Revised Projections Reflect Lower than Expected Immigration Levels

When we released our recent paper on future homeownership rates and household growth by tenure, the analysis relied on the Center’s middle-series household projections, which in turn are based on the Census Bureau’s main population projection series. In normal circumstances, this would be an appropriate baseline: the middle series assumes a level of future immigration that reflects the historical averages of the past three decades. But over the past year, administrative actions have led immigration to drop to much lower levels than previously expected, causing the Congressional Budget Office and others who estimate immigration levels to reduce their projections. Because of this shift, we have published an addendum that applies the paper’s three homeownership-rate scenarios to a second population baseline: the Census Bureau’s low-immigration projection.
The addendum is meant to provide a fuller sense of the range of possible housing demand outcomes over the next decade that now includes a scenario where immigration levels remain below average. The addendum does not replace the original analysis but supplements it with an alternative projection set reflecting conditions that now appear more likely.
Based on the Census Bureau’s middle-series population projections, the Center’s middle‑series household projections assume annual net international immigration of roughly 870,000 people in 2025–2035 (Figure 1). The Center’s low-immigration household projections, again mirroring the Census Bureau’s low‑immigration population assumptions, assume average annual net immigration at about half that number, or closer to 420,000 people.
Figure 1: The Middle-Series (Main) Population Projection Assumes Future Immigration Levels in Line with Decadal Averages Prior to 2020
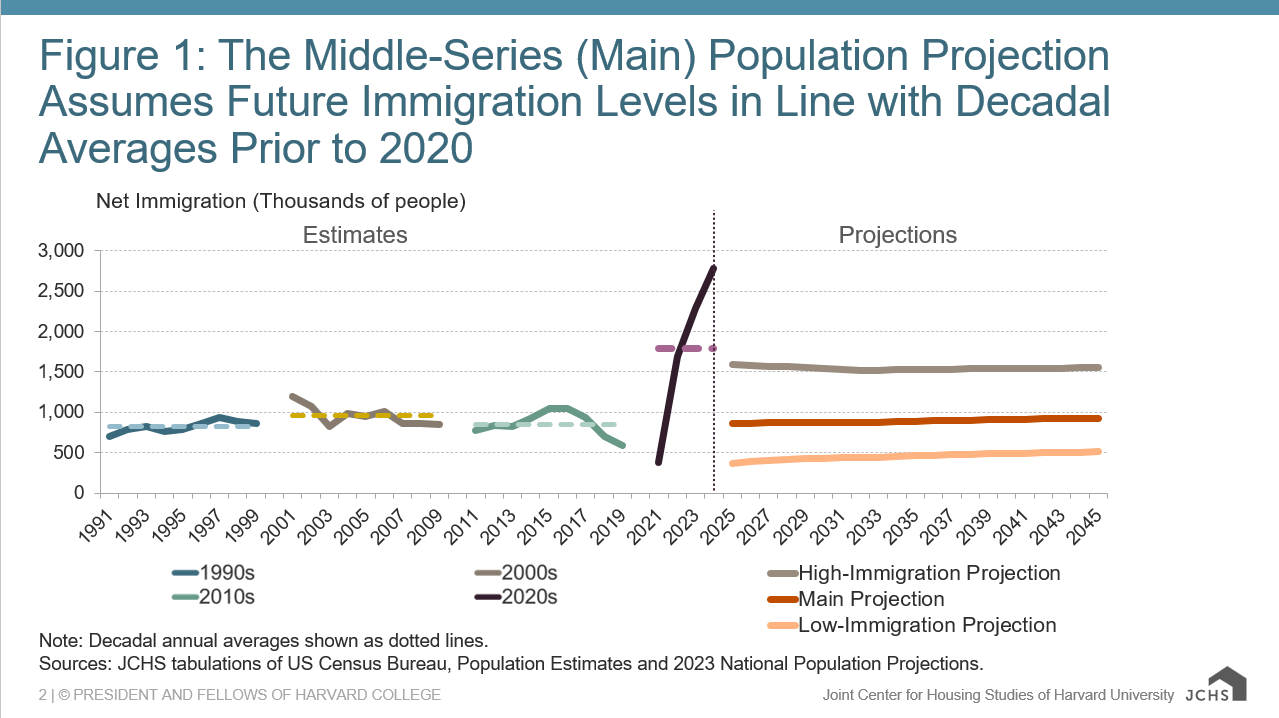
Note: Decadal annual averages shown as dotted lines.
Sources: JCHS tabulations of US Census Bureau, Population Estimates and 2023 National Population Projections.
Total projected household growth falls about 20 percent when switching from the middle series to the low‑immigration series for the years 2025–2035. The reduction is not evenly spread across demographic groups, however, which has implications for our homeownership rate projections. Indeed, most of the decline is in younger households and households of color, since immigrants disproportionately fall into these groups. And because these households are more likely to rent their homes, reducing their numbers results in slightly higher overall homeownership rates. Across the three scenarios in our paper, projected homeownership rates in 2035 are 0.1 to 0.2 percentage points higher under the low-immigration series than under the middle-immigration series.
A higher homeownership rate does not translate to more homeowner households, however. In fact, under the highest scenario for future homeownership rates, switching to the low‑immigration series reduces the projected growth of homeowner households from 685,000 per year (matching the historical average annual growth level since 2000) to just 586,000 per year (about 15 percent below the historical average) (Figure 2). In all, projected annual homeowner growth is lower by 88,000–99,000 households under the low-immigration projections than under the middle-immigration projections across the three scenarios, which amounts to between 15 and 26 percent less growth.
Figure 2: The Low-Immigration Assumption Reduces Homeowner Household Growth in 2025–2035 by 88,000–99,000 Households per Year
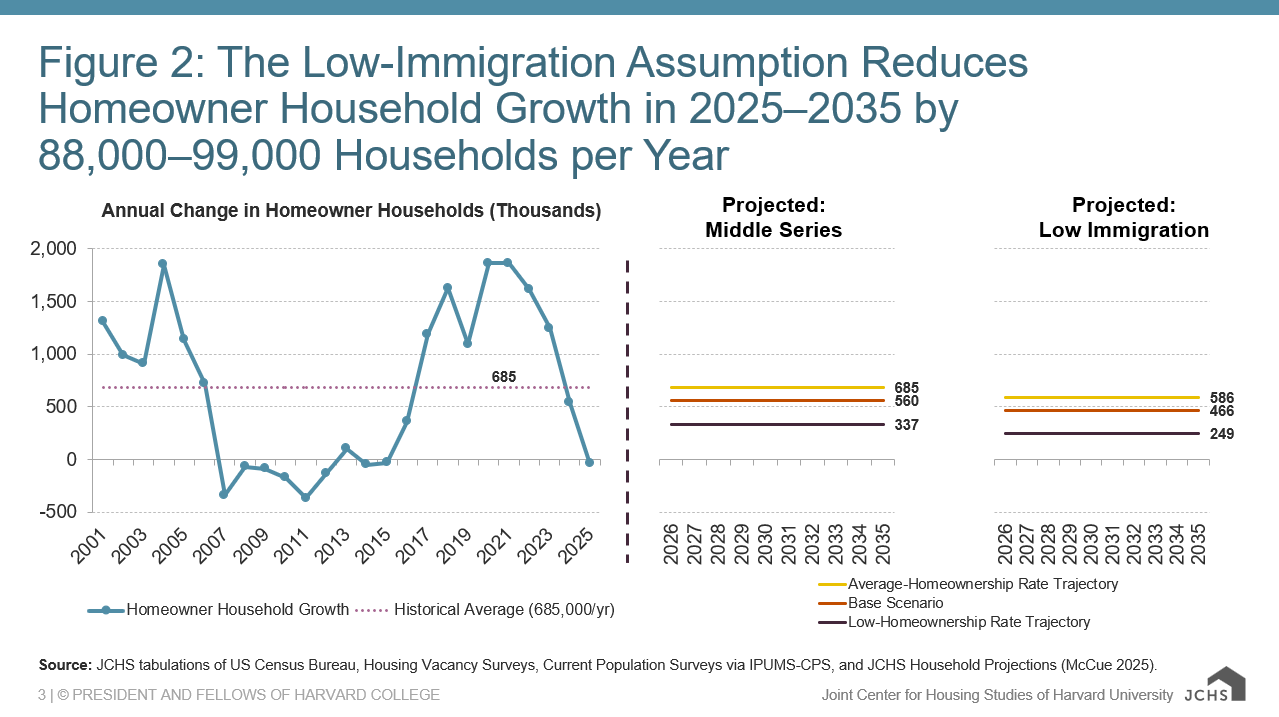
Source: JCHS tabulations of US Census Bureau, Housing Vacancy Surveys and JCHS Household Projections (McCue 2025).
Projections for renter household growth fall as well—by 16 to 42 percent—representing 74,000 to 86,000 fewer renter households per year depending on the scenario (Figure 3). Switching to the low-immigration projections, renter growth falls from 523,000 to 437,000 households per year under the highest scenario, and from 174,000 to just 100,000 households per year under the lowest scenario. Thus, the reductions further depress what were already historically low estimates of both homeowner and renter household formation through 2035.
Figure 3: The Low-Immigration Assumption Reduces Renter Household Growth in 2025–2035 by 74,000–86,000 Households per Year
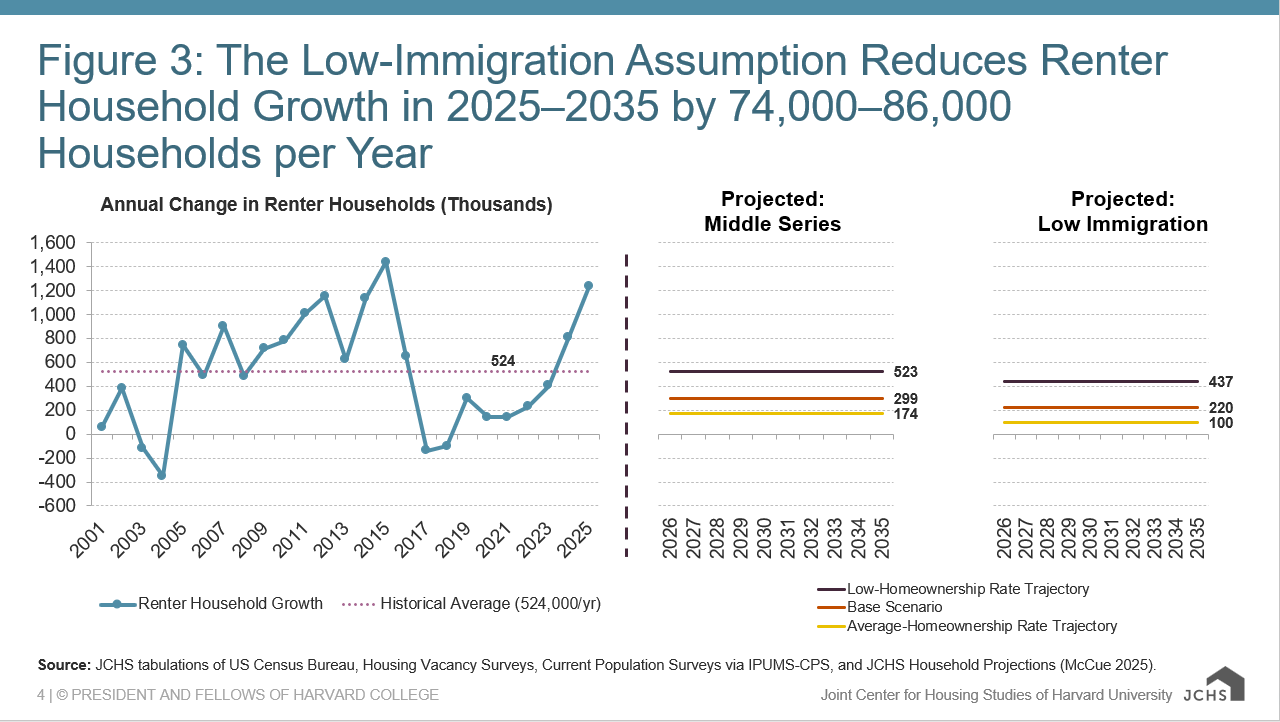
Source: JCHS tabulations of US Census Bureau, Housing Vacancy Surveys and JCHS Household Projections (McCue 2025).
In publishing this addendum, our intent is to reflect the shifting demographic landscape and give policymakers, practitioners, and researchers a clearer sense of the impacts associated with lower than expected immigration. The addendum underscores that the housing outlook for the next decade is more sensitive to immigration trends than some might assume. With population growth slowing and the age distribution of new households tilting older, both rental and ownership markets may experience continued softness in demand that, according to this new analysis, would be softened even further by lower immigration levels.


