Renters Disproportionately Seek Disaster Assistance for Uninsured Vehicle Damages
Damaged vehicles are a common sight in the wake of increasingly frequent weather and climate disasters. One recent estimate suggests that up to 138,000 vehicles were damaged by Hurricane Helene in 2024. For many households, transportation—including car ownership—is the second-largest expense after housing, and car-oriented planning makes vehicle ownership a necessity for accessing employment opportunities. As both climate risks and the number of cars on the road continue to increase, what financial vulnerabilities do vehicle-owning households face, and what are the implications for housing?
Vehicles are widely owned and economically important assets. Approximately 92 percent of US households have access to a vehicle at home. A majority of workers commute to their place of employment in a personal vehicle, and research indicates that vehicle access has a positive relationship with employment outcomes among participants in housing voucher programs. Importantly, vehicles represent a substantial share of wealth for many low-income households (Figure 1), in part because most of these households are renters that own a vehicle but do not own their home (Figure 2). As a result, personal vehicles are the most valuable asset for many households.
Figure 1: Vehicles Represent a Relatively High Share of Owned Asset Value for Low-Wealth Households
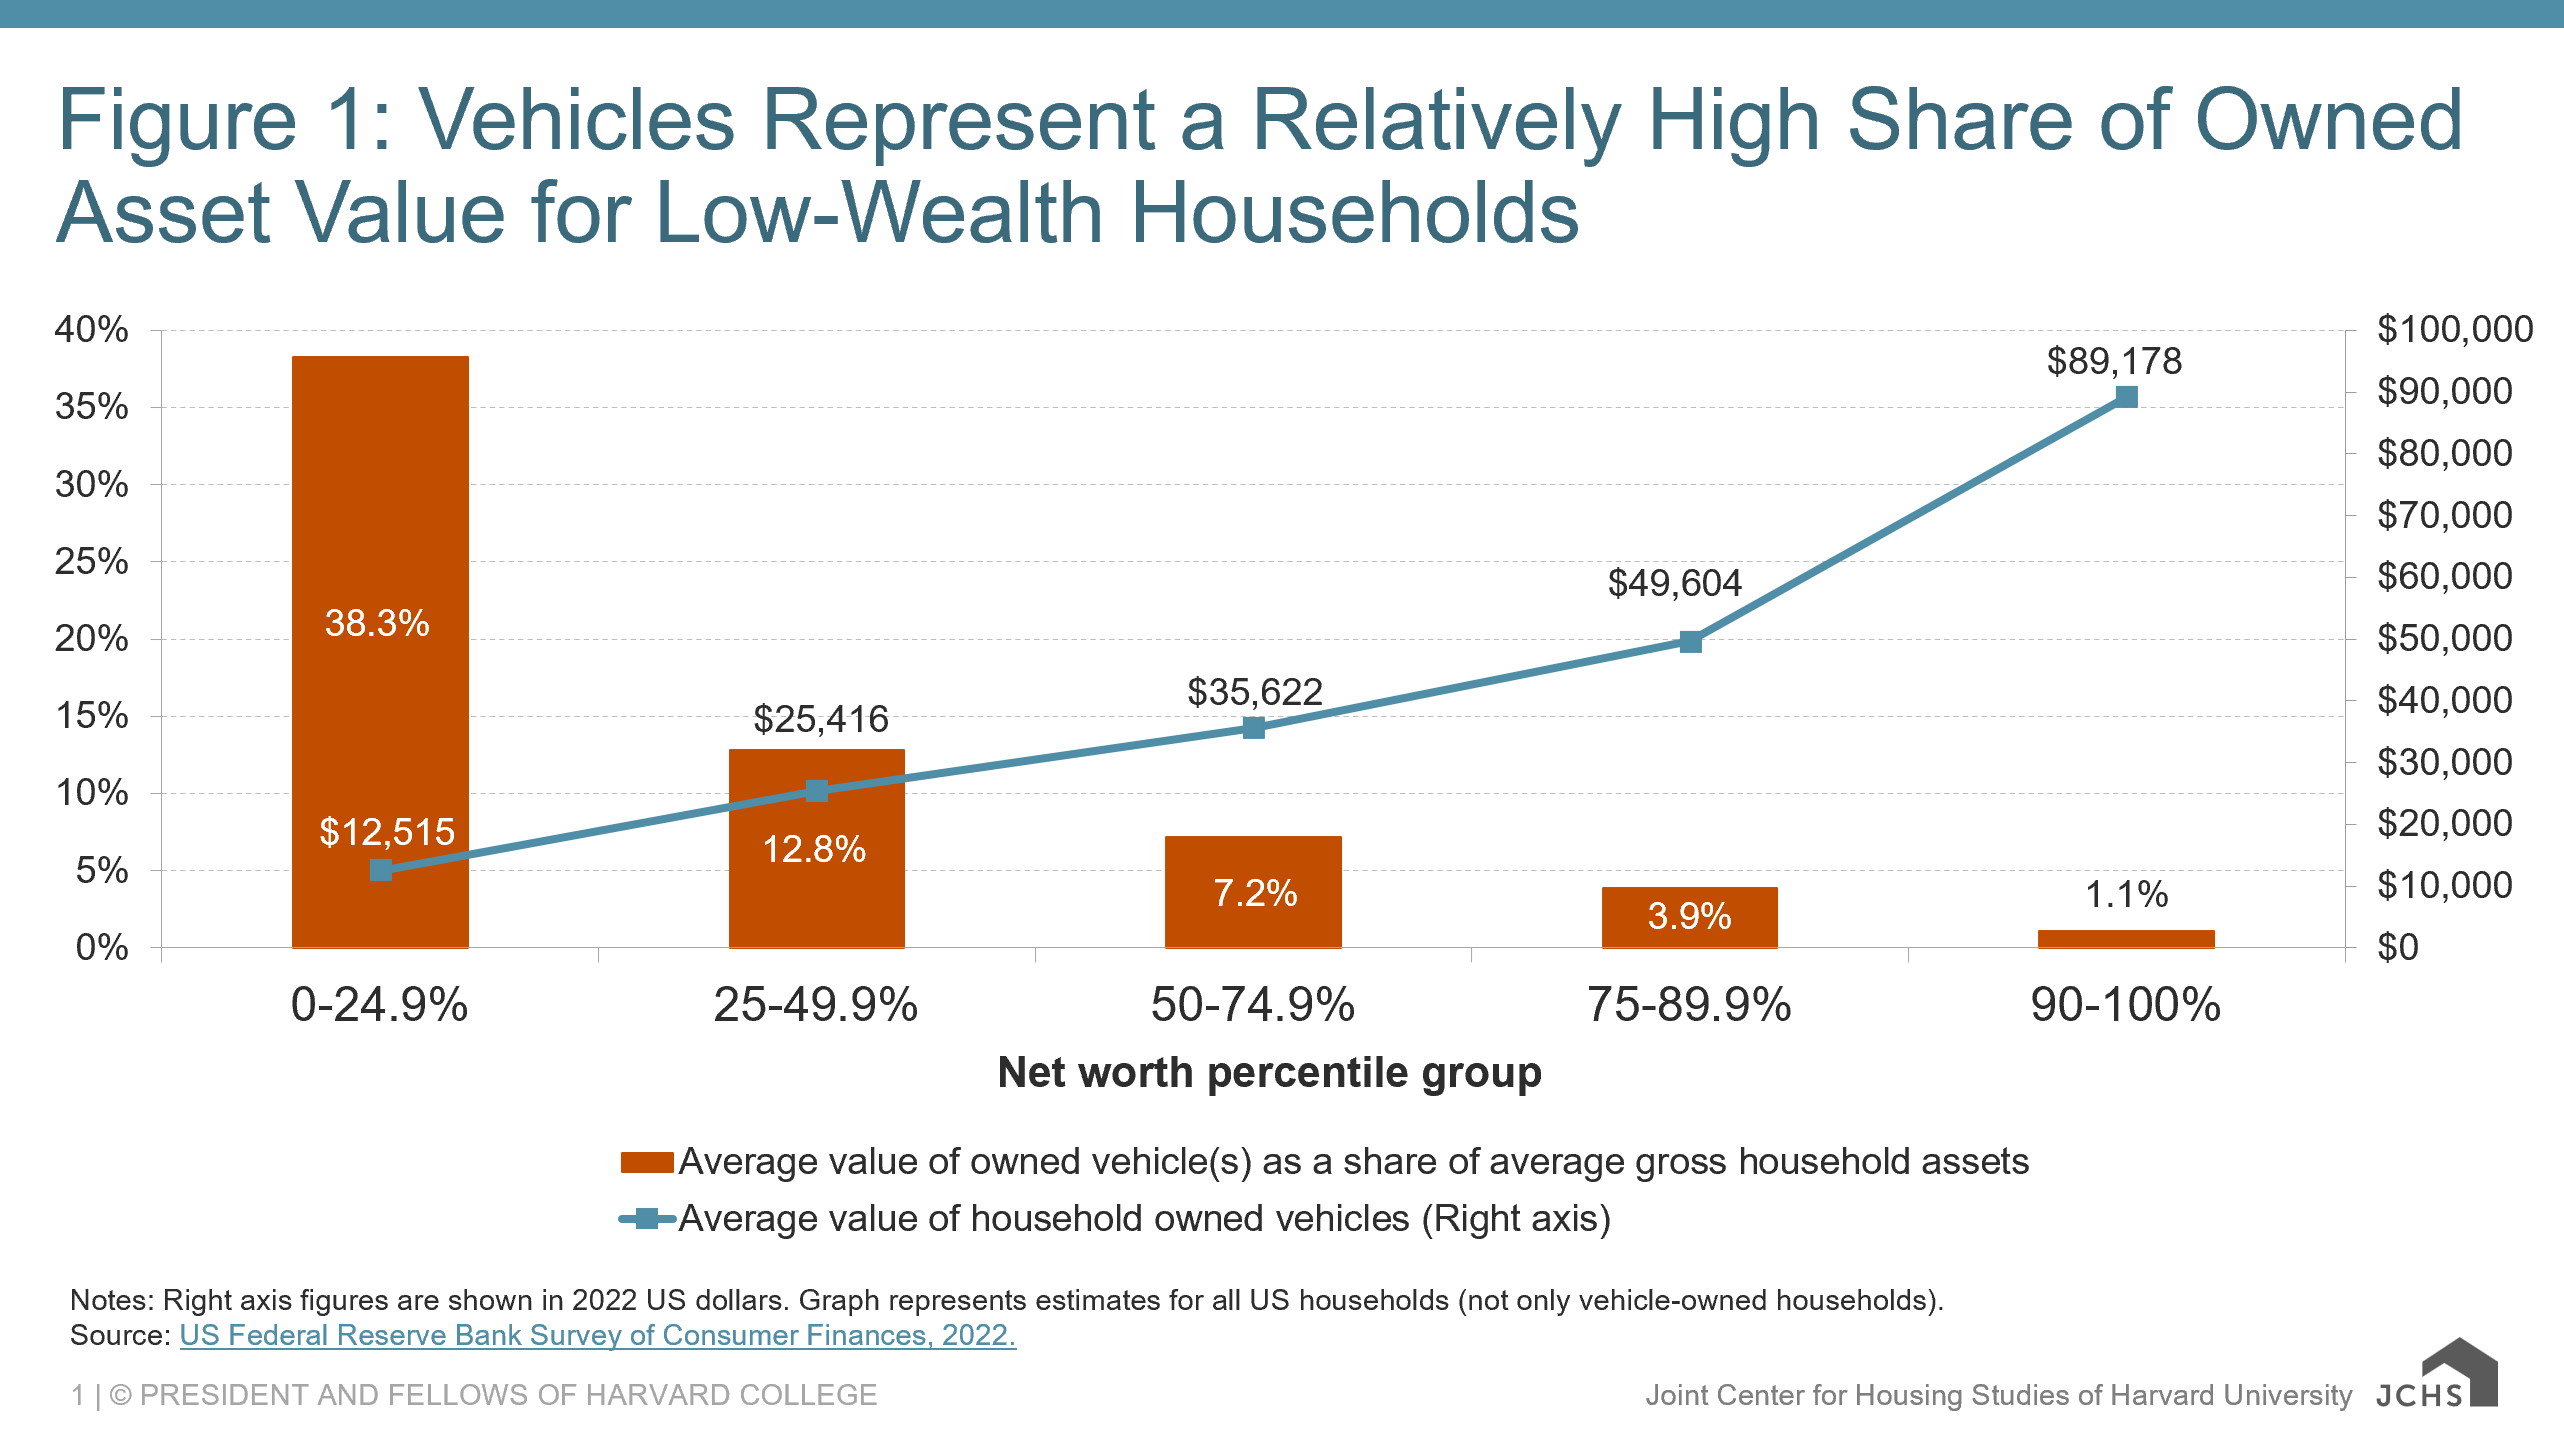
Notes: Right axis figures are shown in 2022 US dollars. Graph represents estimates for all US households (not only vehicle-owned households).
Source: US Federal Reserve Bank Survey of Consumer Finances, 2022.
Figure 2: Vehicle Ownership Rate Is High Among Renter Households

Source: US Federal Reserve Bank Survey of Consumer Finances, 2022.
In a recent paper published in Risk Management and Insurance Review, I analyze newly available Federal Emergency Management Agency (FEMA) data on Transportation Assistance (TA) applications submitted in connection with reported vehicle flood damages following presidentially-declared disasters. The research finds that between 2007–2022, FEMA's Individuals and Households Program (IHP) disbursed more than $160 million in disaster assistance to eligible applicants in connection with uninsured vehicle flood damages. The median FEMA award was equal to approximately 33 percent of median recipient annual income.
Renter households are disproportionately represented among both TA applicants and awardees reporting vehicle flood damage. Renter households comprise more than half of applicants and nearly two-thirds of awardees. Figure 3 illustrates that renter households represent a larger share of vehicle flood damage applications (52.5 percent) than they do for all FEMA IHP applications or for all IHP applications associated with flood disasters. These findings are consistent with prior research highlighting that renters are particularly vulnerable to negative impacts from physical hazard exposure. Households reporting annual incomes of $30,000 or less are similarly overrepresented among both the applicant and awardee pools for FEMA TA.
Figure 3: Low-Income and Renter Households Are Overrepresented Among Disaster Assistance Applications Reporting Vehicle Flood Damage
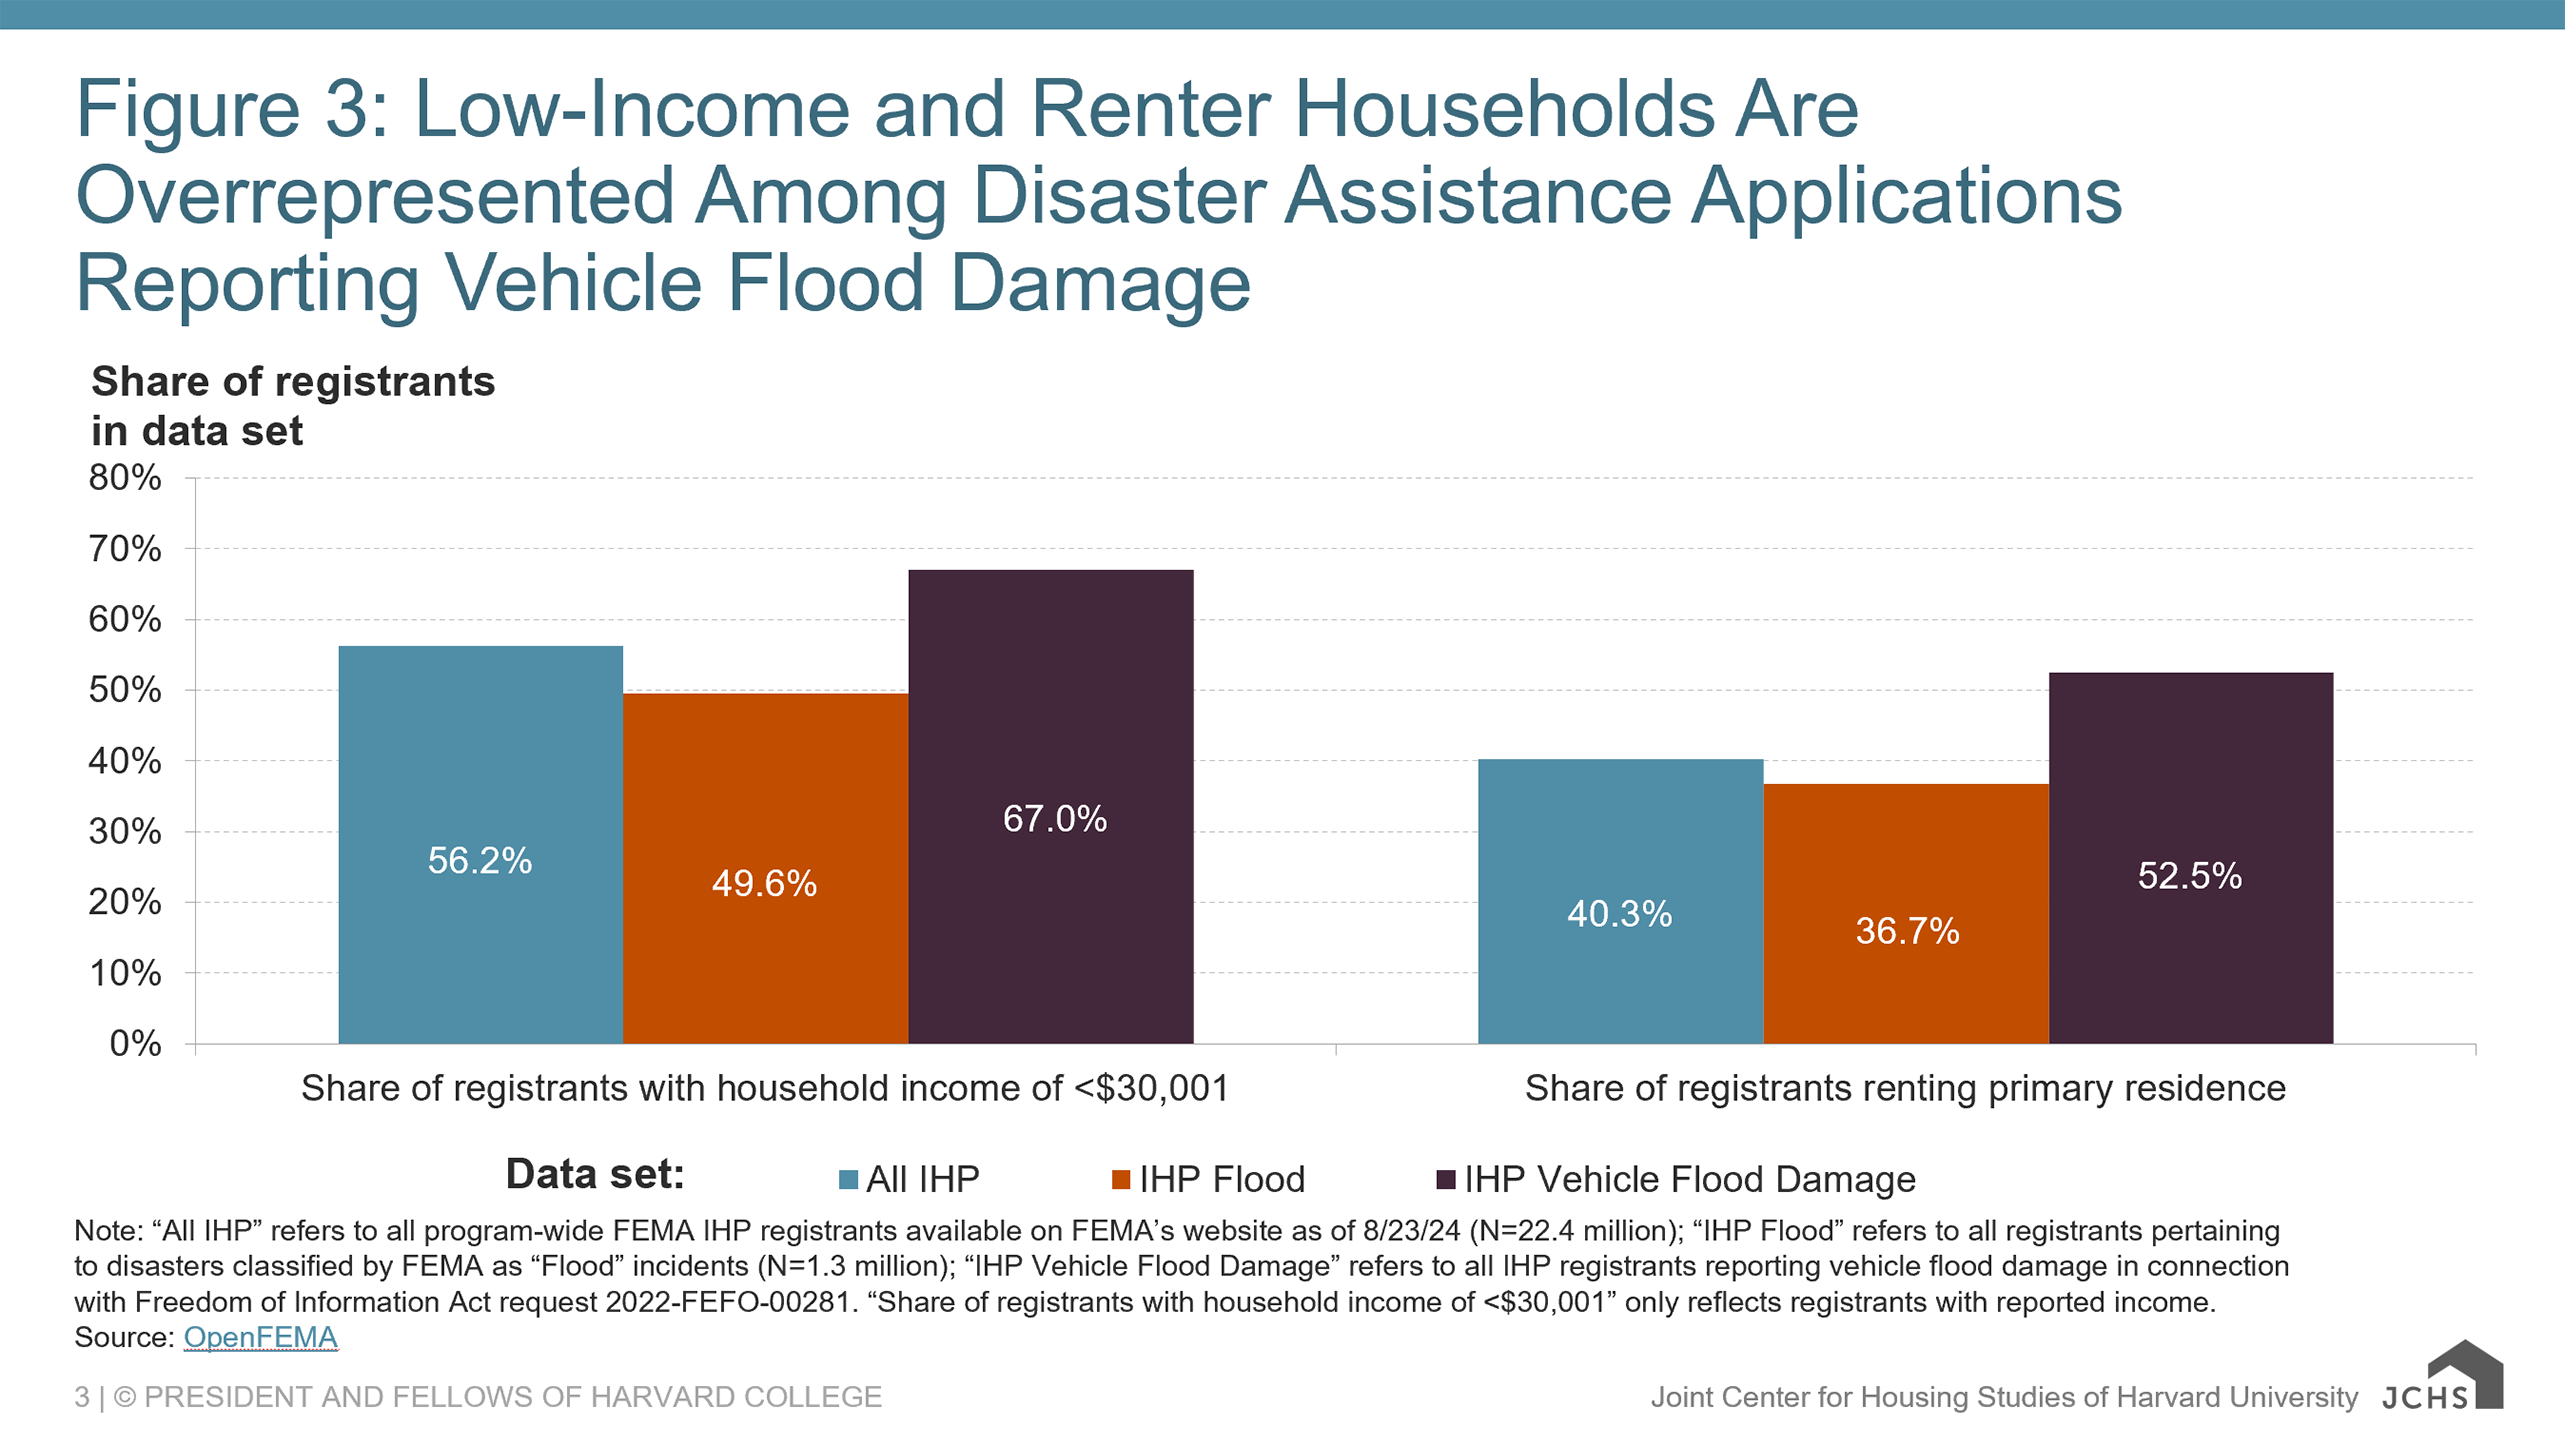
Note: “All IHP” refers to all program-wide FEMA IHP registrants available on FEMA’s website as of 8/23/24 (N=22.4 million); “IHP Flood” refers to all registrants pertaining to disasters classified by FEMA as “Flood” incidents (N=1.3 million); “IHP Vehicle Flood Damage” refers to all IHP registrants reporting vehicle flood damage in connection with Freedom of Information Act request 2022-FEFO-00281. “Share of registrants with household income of <$30,001” only reflects registrants with reported income.
Source: OpenFEMA.
More than half of TA applicants reporting vehicle flood damage also qualified for some form of housing assistance from FEMA. This highlights that housing units and vehicles face similar physical exposures, and households’ financial vulnerabilities vis-à-vis housing and vehicles often go hand in hand. However, approximately one-third of applicants reporting vehicle flood damage experienced no flooding at their primary residence, underscoring that homes and vehicles are not strictly co-located and have distinct risk profiles.
Approximately one-third of US motorists do not have comprehensive coverage, the type of auto insurance policy that covers flood damages as well as other covered perils (e.g., theft, wildfire). While insurance is often a household’s first and best line of financial defense in the wake of a natural disaster, uninsured households commonly rely on a mix of alternative funding sources to support recovery, such as personal savings, transfers from family or friends, private credit, Small Business Administration (SBA) disaster loans, or FEMA grants. Low- and moderate-income households tend to purchase less auto insurance than higher-income households, which may explain the relatively high reliance on federal assistance described above. Taken together, these data highlight how a single uninsured vehicle flood damage event can be a meaningful financial setback for households, especially when federal assistance is unavailable. Prior research demonstrates environmental disasters increase housing instability. Better data collection and more research can improve our understanding of the ways in which key mechanisms (e.g., transportation, employment) influence housing outcomes post-disaster.
Vehicles play a vital role in navigating communities across the country, enabling people to get to and from important places like work, school, and doctors’ offices. As the impacts of climate change continue to unfold, it will be important for researchers and practitioners to evaluate the interconnections between transportation and housing in climate risk management decisions as well as disaster recovery. Potential avenues for mitigating disaster risks for vulnerable vehicle owners include closing insurance literacy gaps or even extending hazard risk disclosure laws from real estate to auto purchases. In response to more frequent and intense hazards, auto insurers and insurance commissioners may prioritize more granular pricing of climate-related peril risk in underwriting. At regional scale, investments in climate-resilient public transportation have the potential to both reduce greenhouse gas emissions and provide safe transportation alternatives.