Interactive Tool Highlights Disparities in Remodeling Spending
Our latest report, Improving America’s Housing 2025, finds significant disparities in remodeling spending. What owners spend on both professional and DIY home improvement projects varies considerably by income, age, race, how long they’ve lived in the home, the year the home was built, and other variables. An interactive tool we released with the report illustrates these disparities (Figure 1):
Figure 1: DIY and Professional Home Improvement Expenditures Differ Significantly by Homeowner and Housing Stock Characteristics
Lower-income homeowners spend far less on improvements than their higher-income counterparts. In 2023, owners in the bottom fifth for incomes (earning less than $37,500) spent an average of $2,300 on improvements, compared to $9,100 for those with incomes in the top fifth (earning over $172,000). Homeowners with the highest incomes also spent nearly three times as much on DIY installations and more than four times as much on professional installations as those with the lowest incomes. The high cost of home improvements jeopardizes safe and habitable living conditions and limits households’ ability to build wealth by undertaking projects that typically boost home values.
Homeowners typically spend the most on improvements in middle age, when their family sizes and incomes are growing (Figure 2). In 2023, homeowners 35–44 and 45–54 had the highest per owner spending, at $5,700 and $5,300, respectively. Owners 55–64 also reported relatively high average per owner spending at $4,900, as compared to owners under 35 ($4,200) and owners 65 and over ($3,800). Although owners under 35 spend far less on professional installations, they are the most likely to pursue DIY projects and had the highest average DIY expenditure of any age group, at $1,000 per owner.
Figure 2: Middle-Age Homeowners Outspend the Youngest and Oldest Households
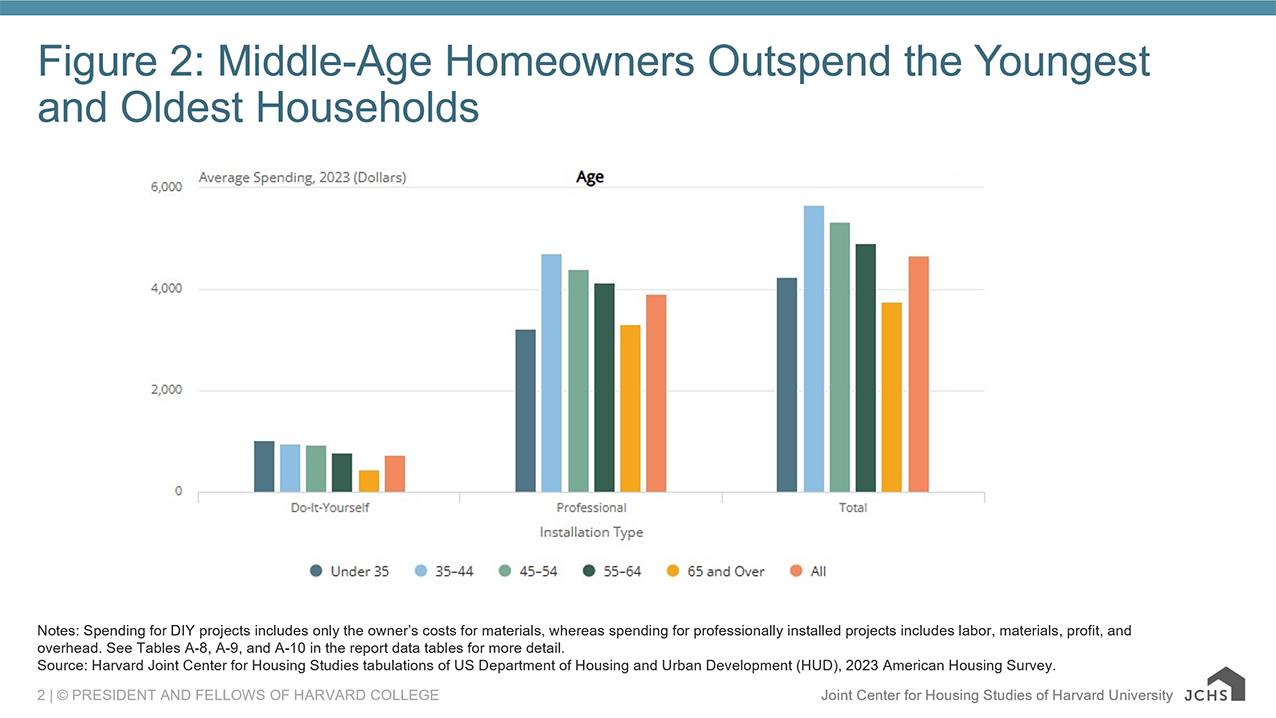
Notes: Spending for DIY projects includes only the owner’s costs for materials, whereas spending for professionally installed projects includes labor, materials, profit, and overhead. See Tables A-8, A-9, and A-10 in the report data tables for more detail.
Source: Harvard Joint Center for Housing Studies tabulations of US Department of Housing and Urban Development (HUD), 2023 American Housing Survey.
Persistent racial disparities have produced unrepresentative patterns of home improvement spending (Figure 3). In 2023, white homeowners spent an average of $5,000 on improvements, well above per owner spending for Black homeowners ($3,600), Hispanic homeowners ($3,700), multiracial homeowners or homeowners of another race ($4,200), and Asian homeowners ($4,500). These disparities reflect centuries of discriminatory policies and practices that have produced enduring inequities in income, homeownership rates, home values, and home equity—all major drivers of remodeling activity. Still, average improvement spending has grown faster for owners of color than for non-Hispanic white owners in recent decades. Between 2003 and 2023, per owner spending by homeowners of color rose 63 percent after adjusting for inflation, compared to 49 percent for their white counterparts.
Figure 3: Racial Disparities in Home Improvement Spending Persist
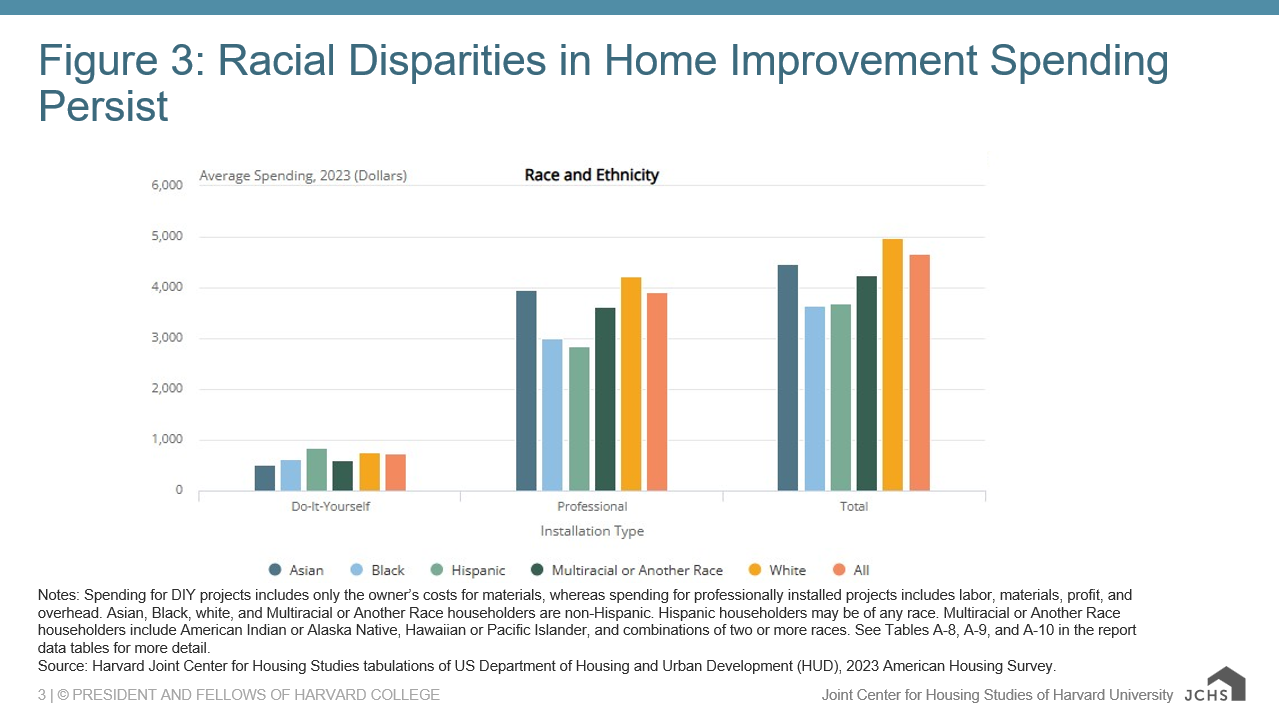
Notes: Spending for DIY projects includes only the owner’s costs for materials, whereas spending for professionally installed projects includes labor, materials, profit, and overhead. Asian, Black, white, and Multiracial or Another Race householders are non-Hispanic. Hispanic householders may be of any race. Multiracial or Another Race householders include American Indian or Alaska Native, Hawaiian or Pacific Islander, and combinations of two or more races. See Tables A-8, A-9, and A-10 in the report data tables for more detail.
Source: Harvard Joint Center for Housing Studies tabulations of US Department of Housing and Urban Development (HUD), 2023 American Housing Survey.
The rising costs of homeownership and other expenses have strained household incomes, leaving little left for home improvements, whether discretionary or required. There is both a market opportunity and a moral imperative to expand improvement and repair assistance to ensure decent housing conditions for all households.