
Five Ways Residential Mobility Has Changed in the Pandemic Era
There were important changes in residential household mobility during the pandemic, some of which proved temporary while others persisted into the post-pandemic period. In a new working paper out today, I examine these changes and place them within the historical context of changing mobility patterns. Here are five ways in which these patterns changed—or did not change—during and after the pandemic.
1. A fleeting increase in moves after the onset of the pandemic only briefly disrupted the long-term decline in household mobility
In March 2020, the number of people filing a temporary change of address request increased by almost 200 percent compared to March 2019, while permanent change of address requests jumped by 12 percent, according to the United States Postal Service. However, in addition to many of these moves being temporary, these requests became less frequent in later months, resulting in only small increases in the number of people moving in 2020 compared to 2019. In 2021 and 2022, the total number of change of address requests fell, which agrees with other data sources showing a continuation of the long-term decline in residential mobility that I have previously discussed. This decline continued after the pandemic (during-pandemic is defined here as 2020–2022; post-pandemic as 2023–2024), with the household mobility rate falling to a historically low rate of 8.2 percent in 2024, according to the Current Population Survey (CPS).
2. Households are crossing state lines at pre-pandemic rates after a sharp during-pandemic increase
Despite the ongoing decline in residential mobility, interstate migration—which typically accounts for less than 20 percent of moves but has an important effect on population change—became much more common during the pandemic. The household interstate migration rate rose to 2.3 percent in 2021 and 2.5 percent in 2022, surpassing even pre-Great Recession rates (Figure 1). In 2021, this increase was entirely due to remote worker householders, who both became more numerous and moved across state lines at a higher rate. The increase in 2022 was driven by commuter householders as remote work became less common. Overall, this during-pandemic increase in interstate migration resulted in nearly 700,000 more households moving across state lines than if the pre-pandemic plateau of 2.1 percent that held from 2013–2019 had continued. After the pandemic, the interstate migration rate returned to pre-pandemic levels, falling to 2.2 percent in 2023.
Figure 1: Interstate Migration Rose Rapidly During the Pandemic
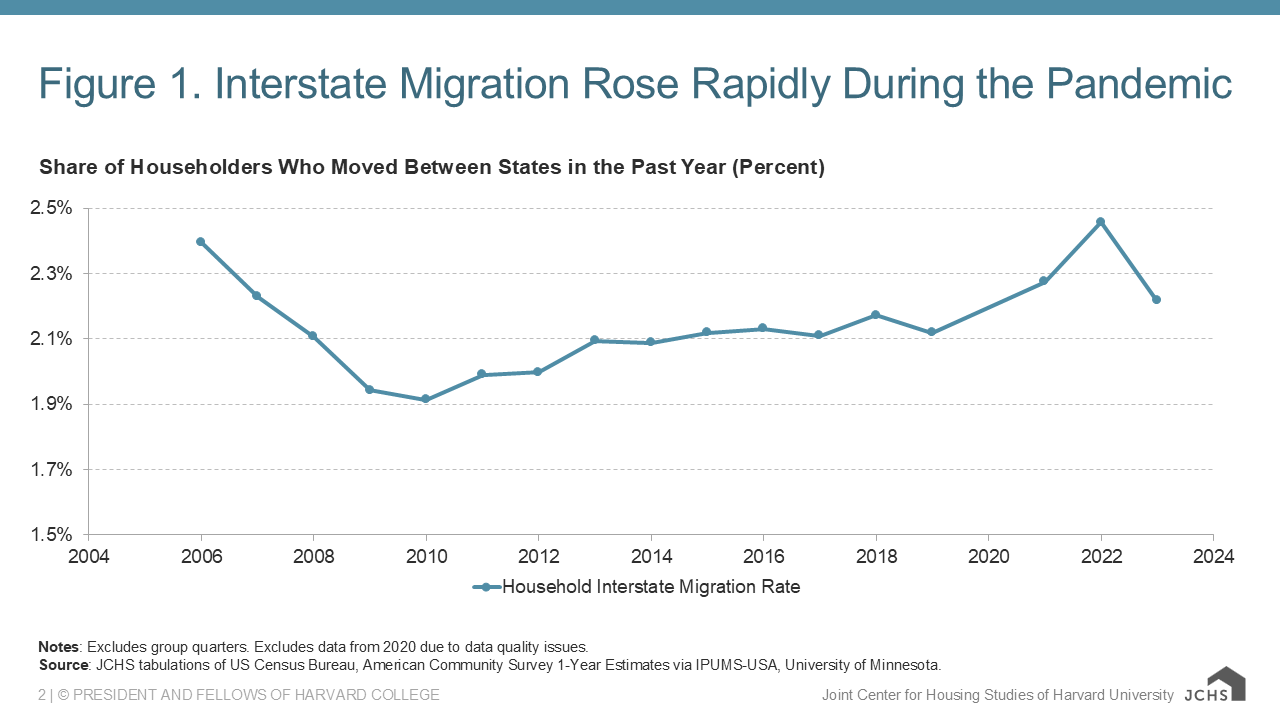
Notes: Excludes group quarters. Excludes data from 2020 due to data quality issues.
Source: JCHS tabulations of US Census Bureau, American Community Survey 1-Year Estimates via IPUMS-USA, University of Minnesota.
3. Homeowners locked into low mortgage rates are staying put and dragging down homeowner mobility rates after a during-pandemic spike
Historically low interest rates prompted many to purchase a home during the pandemic—especially millennials, who were at prime homebuying ages and contributed to a sharp rise in first-time homebuying. This resulted in a substantial uptick in the homeowner household mobility rate, which rose from 6.2 percent in 2019 to 6.8 percent in 2021, the highest rate in more than a decade. The overall mobility rate declined in 2021, however, because this increase was counteracted by a sharp decline in renter household mobility. As interest rates rose starting in 2022, millions of homeowner households with low interest rates experienced a lock-in effect and homeowner mobility fell sharply to 5.5 percent in 2023. This decline counteracted the recovery in renter mobility that year, and the overall mobility rate continued its downward trend.
4. More people are moving to less dense communities, continuing a during-pandemic trend
The changes outlined so far all proved to be temporary, reverting to pre-pandemic norms by the end of the pandemic. The elevated migration to less dense communities, however, has proved more persistent. Starting in 2020–2021, net inflows to lower-density suburban, smaller metro, and non-metro counties spiked (Figure 2). This was particularly notable for non-metro counties, which are largely rural and had consistent aggregate net outflows leading up to the pandemic. Net inflows remained elevated for these lower-density counties through 2024, while urban counties had high net outflows and higher-density suburban counties had aggregate net inflows switch to net outflows.
Figure 2: Migration Flows Spiked During the Pandemic and Persisted in Less Dense Communities After the Pandemic
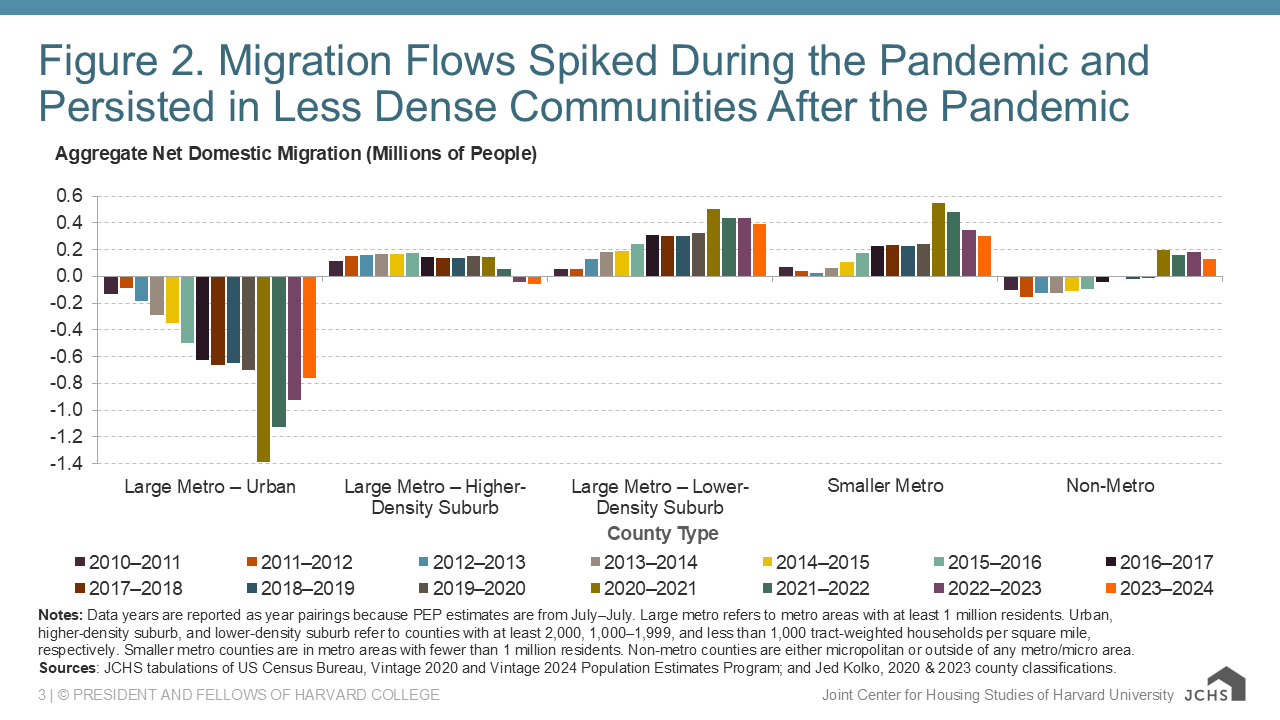
Notes: Data years are reported as year pairings because PEP estimates are from July–July. Large metro refers to metro areas with at least 1 million residents. Urban, higher-density suburb, and lower-density suburb refer to counties with at least 2,000, 1,000–1,999, and less than 1,000 tract-weighted households per square mile, respectively. Smaller metro counties are in metro areas with fewer than 1 million residents. Non-metro counties are either micropolitan or outside of any metro/micro area.
Sources: JCHS tabulations of US Census Bureau, Vintage 2020 and Vintage 2024 Population Estimates Program; and Jed Kolko, 2020 & 2023 county classifications.
5. The Sunbelt remains dominant in regional migration, but signs of a shift are emerging
The Sunbelt has been gaining domestic migrants for much of the post-WWII era, and that trend continued before, during, and after the pandemic. The states with the highest average net inflows during the pandemic were all in the Sunbelt, led by Florida, Texas, North Carolina, and Arizona. Inflows moderated after the pandemic, but continued to be highest in the Sunbelt, led by Texas, Florida, North Carolina, and South Carolina. However, notable shifts took place in many states in the Midwest and Northeast, where outflows were either lower than they had been before the pandemic, or net outflows had switched to net inflows (Figure 3). This may be evidence of a coming shift in migration towards "Snow Belt" states.
Figure 3: Many Sunbelt and Low-Density States Had Higher Net Inflows After the Pandemic than Before It
Notes: Pre-pandemic net domestic migration flows are annual averages from 2010–2011 through 2019–2020. Post-pandemic net domestic migration flows are annual averages from 2022–2023 to 2023–2024.
Source: JCHS tabulations of US Census Bureau, Vintage 2020 and Vintage 2024 Population Estimates Program.
There were some ways in which residential mobility trends did not fundamentally change during and after the pandemic, including the continued flow towards the Sunbelt and the continued decline in the overall mobility rate. In other ways, mobility temporarily changed but had substantial effects, including the uptick in homeowner mobility and interstate migration. In contrast, the elevated migration to lower-density suburbs, smaller metro areas, and non-metro areas persisted through 2024, and evidence shows this is having a substantial effect on home prices, the ramifications of which will be felt for years to come.