Six Takeaways from America’s Rental Housing 2024
Our new report America’s Rental Housing 2024 examines the state of rental housing in the US, including the critical affordability and policy challenges facing the nation. Among the report’s many takeaways, six key findings stand out.
1. Rental markets are softening.
After an overheated 2021 and 2022, rental markets finally showed signs of cooling. Apartment rent growth peaked at a record-breaking 15 percent annually in the first quarter of 2022 before starting to decelerate (Figure 1). By the third quarter of 2023, rents grew by just 0.4 percent year over year.
Figure 1: Apartment Rent Growth Has Stalled
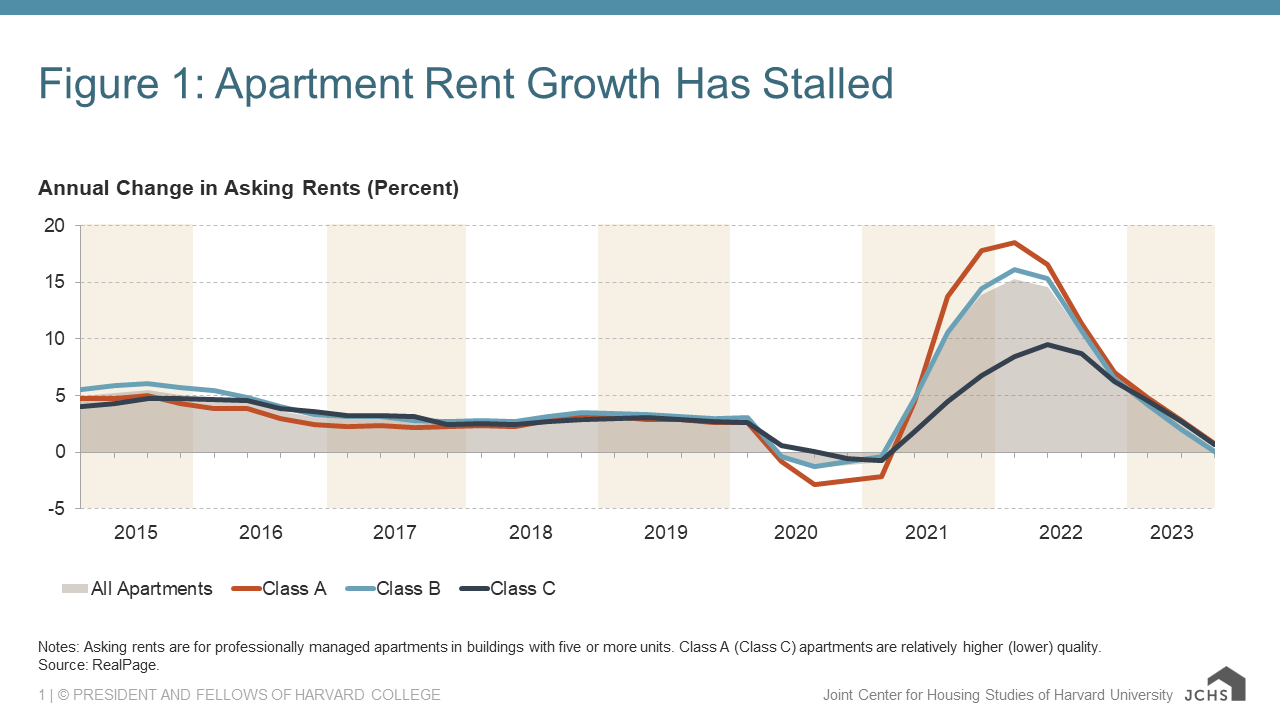
Notes: Asking rents are for professionally managed apartments in buildings with five or more units. Class A (Class C) apartments are relatively higher (lower) quality. Source: RealPage.
Rising vacancy rates helped slow rent growth. The apartment vacancy rate climbed to 5.5 percent in the third quarter of 2023 from a record low of just 2.5 percent in early 2022. Historically strong multifamily completions were primarily responsible for pushing up vacancy rates; 436,000 multifamily units came online in the third quarter of 2023 on a seasonally adjusted annualized basis.
2. Affordability is worse than ever before.
Although rental markets are cooling, asking rents remain above pre-pandemic levels and affordability conditions are the worst on record. In 2022, the number of cost-burdened renter households hit a new high of 22.4 million (Figure 2). This marked an increase of 2 million households since 2019 and pushed up the share of cost-burdened renter households to 50 percent, a 3.5 percentage point jump in just three years.
Figure 2: The Number of Cost Burdened Renters Hit an All-Time High
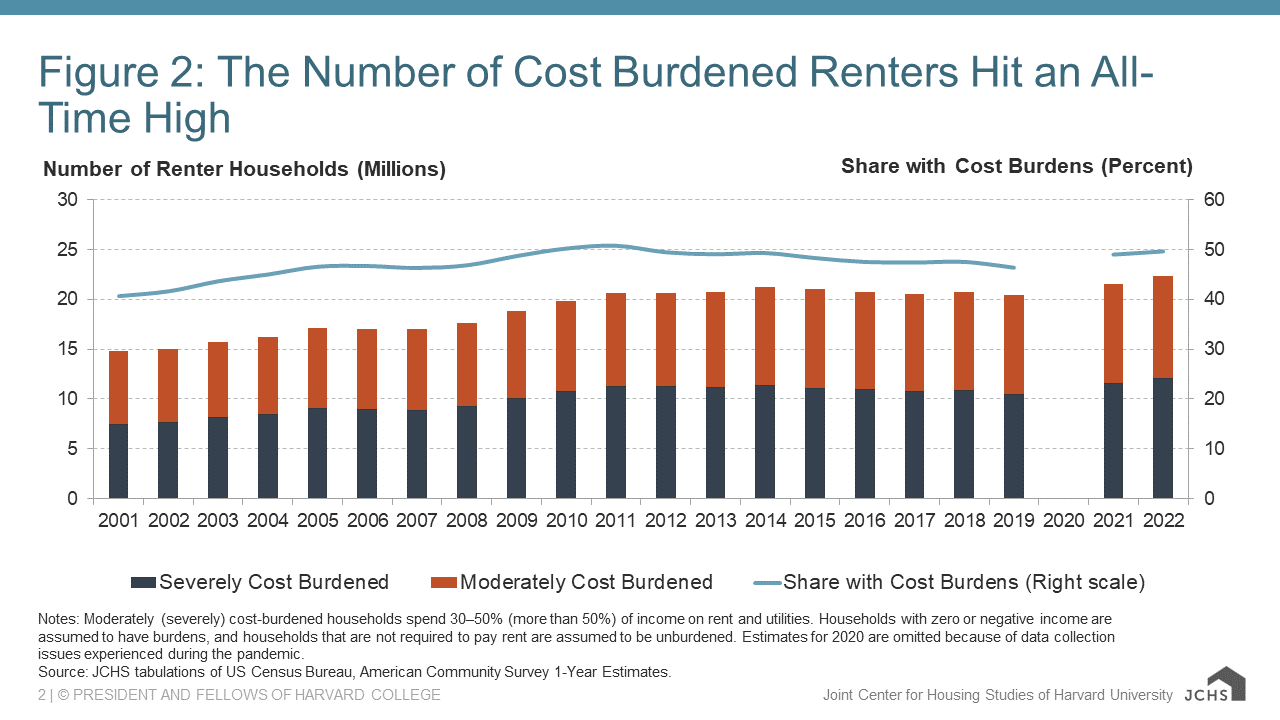
Notes: Moderately (severely) cost-burdened households spend 30–50% (more than 50%) of income on rent and utilities. Households with zero or negative income are assumed to have burdens, and households that are not required to pay rent are assumed to be unburdened. Estimates for 2020 are omitted because of data collection issues experienced during the pandemic.
Source: JCHS tabulations of US Census Bureau, American Community Survey 1-Year Estimates.
An upward shift in the rent distribution contributed to this trend (Figure 3). Since 2012, the market has lost more than 2.1 million units renting for less than $600 and 4.0 million units renting for $600 to $999. During the same period, the market gained 8.4 million units renting for at least $1,400, driven by rent increases and high-end new construction. Not only have rents risen, but they have outpaced incomes over the last two decades. Among renter households with an annual income under $30,000, the median amount of money left over after paying for rent and utilities was just $310 a month, an-all time low and a drop of 47 percent since 2001 when adjusting for inflation.
Figure 3: US Continues to Lose Low-Cost Rental Housing
3. Housing instability is rising.
Early pandemic efforts to keep renters housed—including eviction moratoriums, income supports, and a $46.55 billion emergency rental assistance program—were winding down as rents skyrocketed, leaving many renter households vulnerable to housing instability. At the end of 2022, evictions neared pre-pandemic levels and remained elevated through the middle of 2023, when about 12 percent of renter households reported that they were still behind on rent.
The end of pandemic relief measures and historically high rent growth also led to a dramatic rise in homelessness. The number of people experiencing homelessness jumped by nearly 71,000, from January 2022 to January 2023, the largest single-year increase on record, to an all-time high of 653,100 people (Figure 4).
Figure 4: Homelessness Is Rising Across the Country
The number of people staying in places not intended for human habitation hit an unprecedented 256,610 people, up 48 percent since 2015. As the number of people staying in unsheltered locations rose in expensive states like California, Oregon, and Washington, traditionally more affordable states like Ohio and Tennessee also had large increases over this period.
4. Rental assistance falls far short of the need.
Despite deteriorating housing affordability and stability, rental assistance has not expanded to meet the growing need. The number of very low-income renter households making no more than 50 percent of area median income grew by 4.4 million from 2001 to 2021, but the number of assisted households in this income range increased by just 910,000. This left 14 million income-eligible households to fend for themselves in an increasingly unaffordable market (Figure 5). Of those not receiving assistance, 8.5 million experienced worst case housing needs, meaning they spent more than half of their income on housing and/or lived in severely inadequate housing. A full 60 percent of unassisted households had worst case needs in 2021, up from 47 percent in 2001.
Figure 5: The Rental Assistance Shortage Continues to Worsen
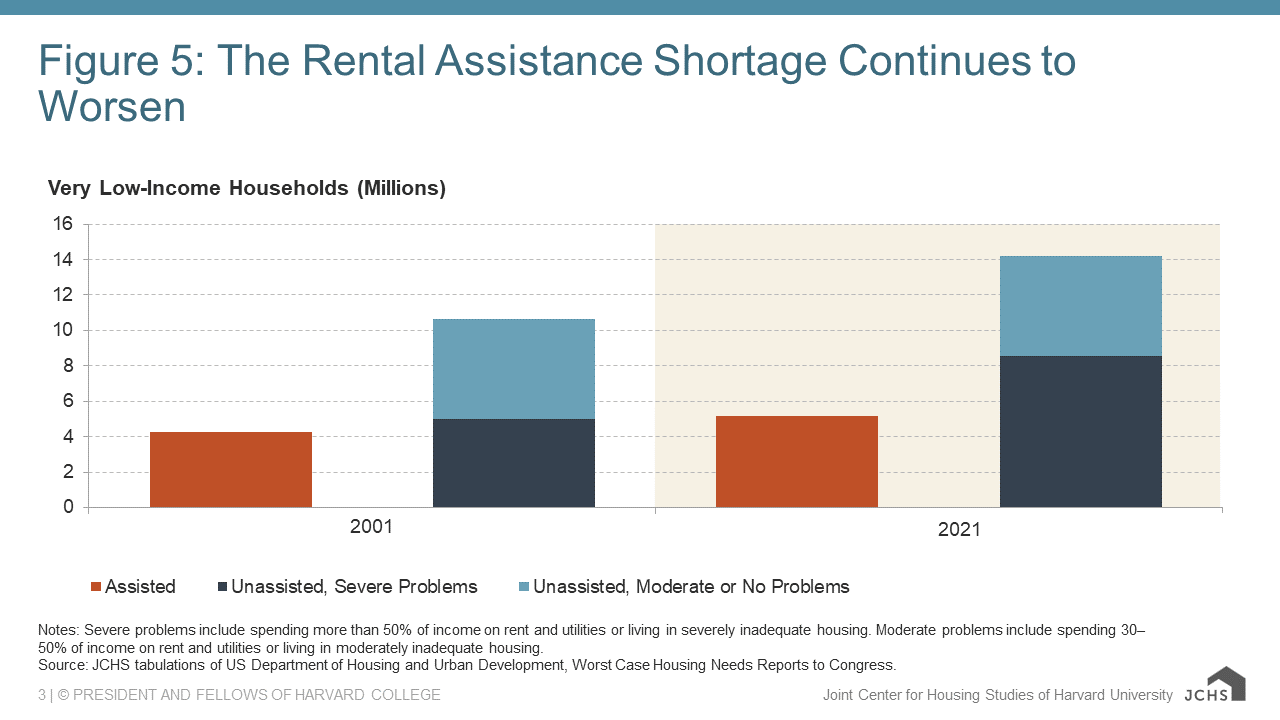
Notes: Severe problems include spending more than 50% of income on rent and utilities or living in severely inadequate housing. Moderate problems include spending 30–50% of income on rent and utilities or living in moderately inadequate housing.
Source: JCHS tabulations of US Department of Housing and Urban Development, Worst Case Housing Needs Reports to Congress.
5. The rental stock has significant investment needs.
The rental stock is older than it has ever been with a median age of 44 years, up from 34 years two decades ago, and heightening the need for substantial investments. As of 2021, nearly 4 million renter households live in substandard conditions and even many physically adequate units have significant repair needs. The Federal Reserve Bank of Philadelphia estimated it would cost $51.5 billion to address the repair needs of the occupied rental stock.
The rental stock also requires upgrades to reduce its contribution to climate change and improve its resiliency to environmental hazards. About half of renters making less than $30,000 experienced energy insecurity in 2020, and extreme weather variability and rising temperatures will only increase home energy demand and renters’ housing costs. The Inflation Reduction Act included about $9 billion for household rebates and tax credits for approved upgrades as well as $1 billion to make the HUD-assisted stock more energy and water efficient. Additional federal resources are also needed to make resiliency improvements for the 18 million occupied rental units in areas with at least moderate annual economic losses from environmental hazards (Figure 6).
Figure 6: More Than 18 Million Rental Units Are Under Threat from Environmental Hazards
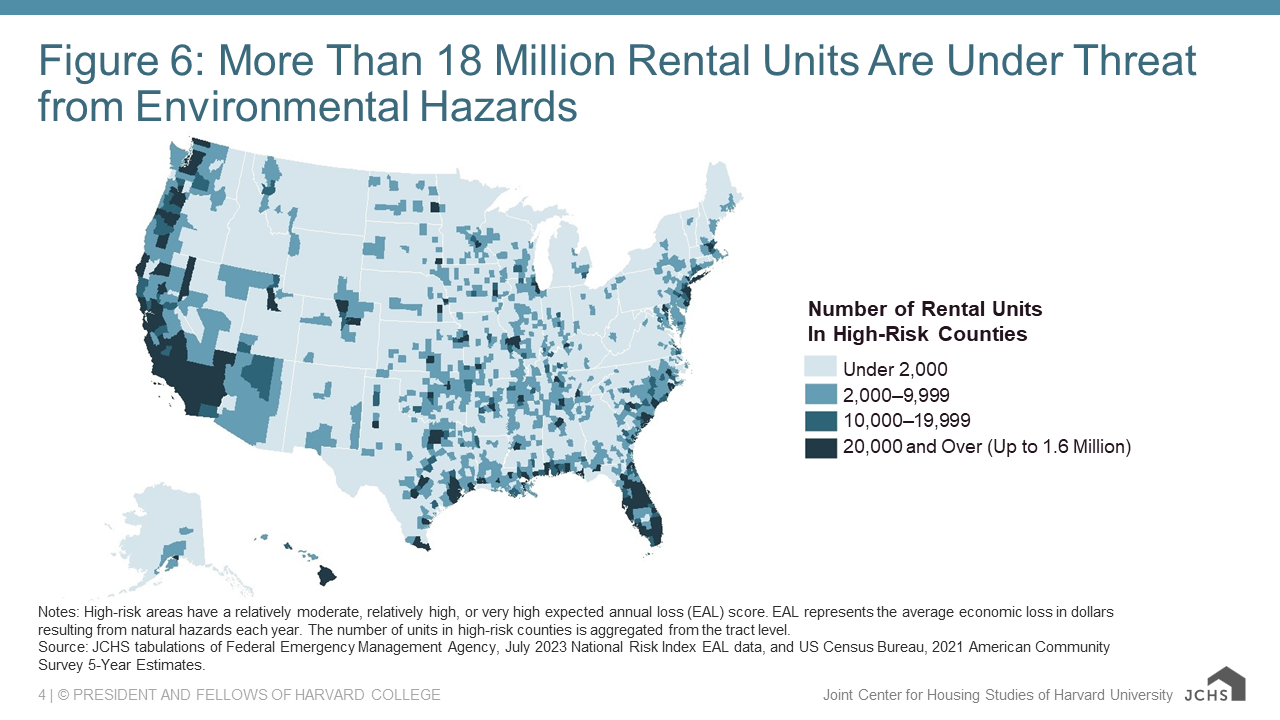
Notes: High-risk areas have a relatively moderate, relatively high, or very high expected annual loss (EAL) score. EAL represents the average economic loss in dollars resulting from natural hazards each year. The number of units in high-risk counties is aggregated from the tract level.
Source: JCHS tabulations of Federal Emergency Management Agency, July 2023 National Risk Index EAL data, and US Census Bureau, 2021 American Community Survey 5-Year Estimates.
6. High interest rates are dampening rental market activity.
The high interest rate environment over the last year has increased the cost of debt to acquire and build multifamily properties. High treasury yields have also pushed up the cost of equity as apartment investors expect greater returns to compete with relatively low-risk treasuries. In this environment, deals are less profitable, which has depressed both multifamily lending and apartment transactions.
Most concerning is the swift slowdown in multifamily construction. Though starts climbed during the pandemic and remained among some of the highest levels in the last two decades through the first half of 2023, hitting a seasonally adjusted annual rate of 571,000 units in May, they have since dropped. By October, starts were down 30 percent year over year (Figure 7). While there are a record-high number of units currently under construction, continued market cooling and high interest rates could lead to further declines in multifamily starts, creating supply challenges down the road.
Figure 7: New Multifamily Construction Has Quickly Declined
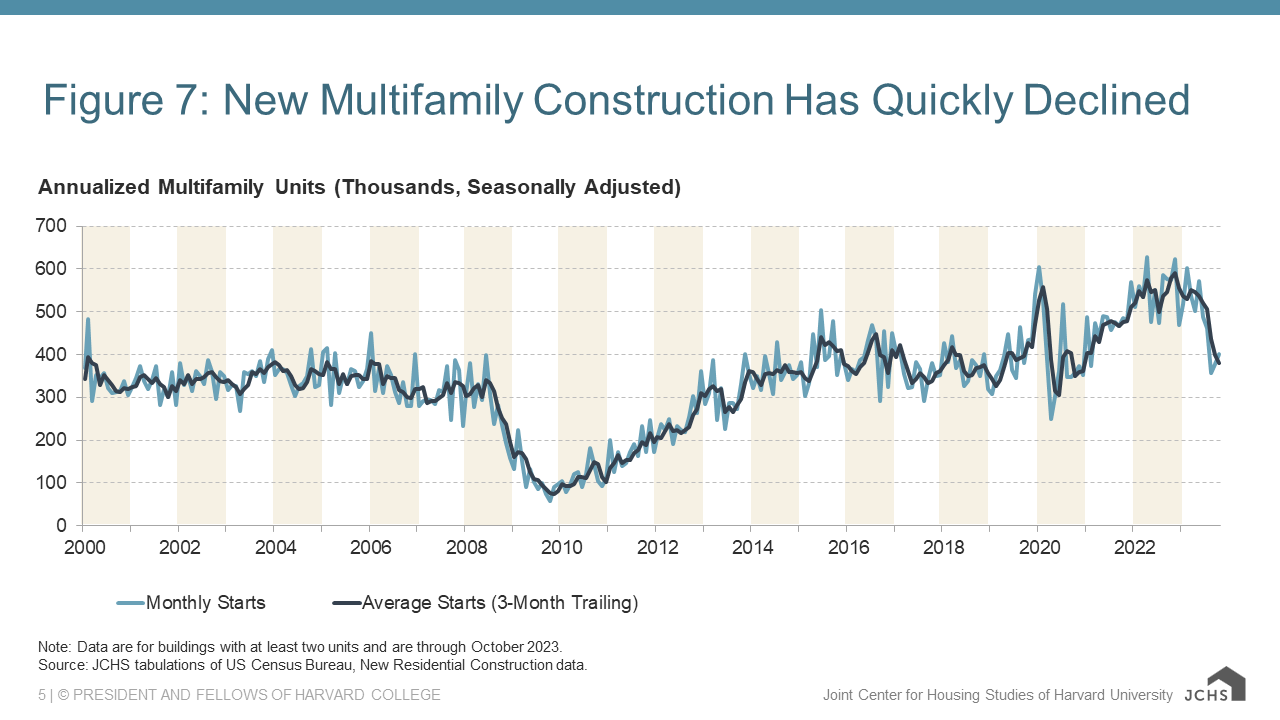
Note: Data are for buildings with at least two units and are through October 2023.
Source: JCHS tabulations of US Census Bureau, New Residential Construction data.
Looking forward, the coming months will likely be tough for renter households and property owners alike. While rent deceleration will be welcome news for renters, the magnitude of pandemic-era rent increases have created difficult affordability conditions that will not be easily undone, especially for the lowest-income renters. Meanwhile, slowing returns and rapidly rising costs will pose a challenge for property owners. But the significant equity built up during the pandemic boom should help prevent widespread distress.
Pandemic-era relief measures showed that the nation can keep tenants stably housed while also keeping landlords solvent. This level of commitment is needed going forward to expand housing assistance, preserve the affordable stock, and make crucial improvements to the existing rental stock.