Worst Case Housing Needs for Renters Ticked Down, But Remain High

Rising renter incomes and expanded rental assistance modestly reduced the number of renter households with worst case needs in 2023. According to a new report from the US Department of Housing and Urban Development (HUD), this marked the first decrease in worst case needs since 2017 following steep increases. The recent improvement resulted from shifting trends that reduced the total number of very low-income renter households and expanded affordability.
HUD considers renter households to have worst case needs if they have very low incomes (no more than 50 percent of area median income), do not receive rental assistance, and spend more than half of their income on rent and utilities or live in severely inadequate housing.
At last measure in 2023, 8.46 million households met these criteria. Worst case needs rose from 2017 to 2021, growing from 7.72 million to a record-high 8.53 million (Figure 1). While the recent decrease was small (62,000 households), it was a notable change from consecutive increases.
Figure 1: Worst Case Housing Needs Decreased Modestly at Last Measure

Notes: Renter households have worst case needs if they make no more than 50% of area median income, do not receive rental assistance, and spend more than half of their income on rent and utilities or live in severely inadequate housing.
Source: JCHS tabulations of US Department of Housing and Urban Development, Worst Case Housing Needs Reports to Congress.
The decrease resulted from a combination of factors that differed substantially from previous years (Figure 2). The analysis presented in the report points to four important trends that changed and ultimately helped reduce worst case needs from 2021 to 2023.
Figure 2: Renter Income Growth and Greater Access to Rental Assistance Helped Reduce Worst Case Housing Needs
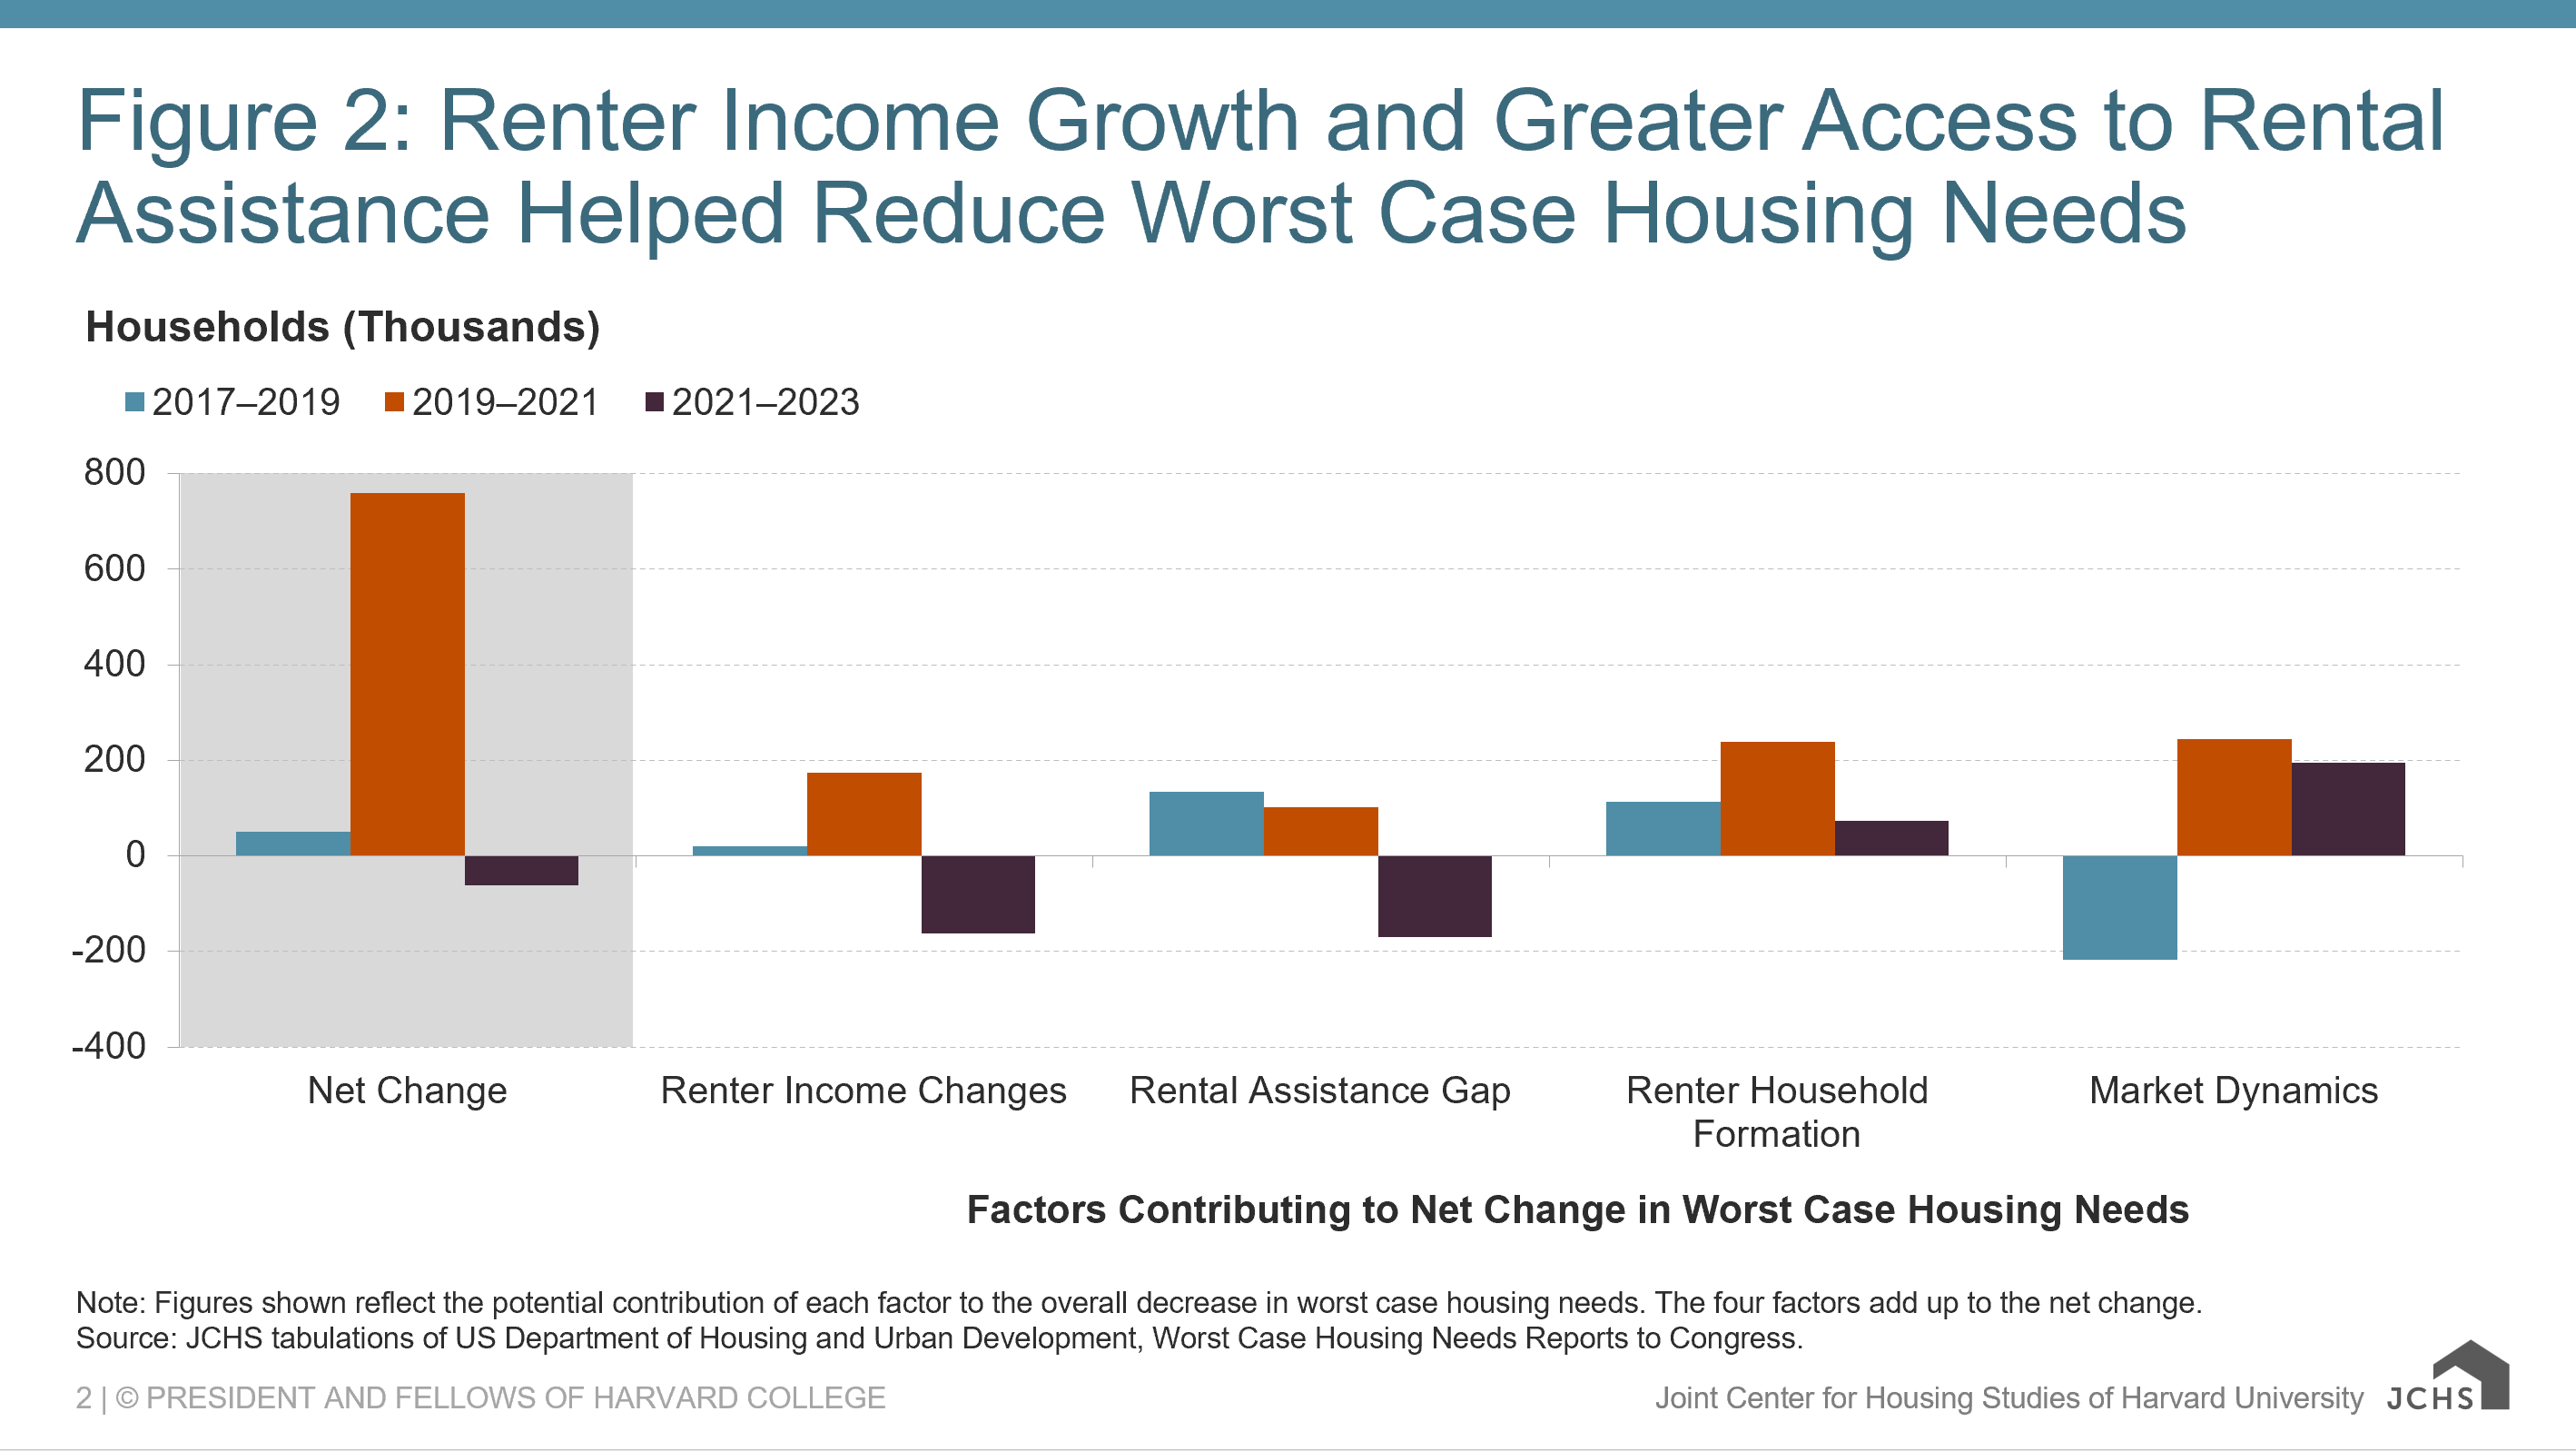
Note: Figures shown reflect the potential contribution of each factor to the overall decrease in worst case housing needs. The four factors add up to the net change.
Source: JCHS tabulations of US Department of Housing and Urban Development, Worst Case Housing Needs Reports to Congress.
First, renter incomes grew, reducing the number of households that fell within the very low-income threshold. HUD estimates that changes in renter incomes had the potential to reduce worst case needs by 163,000 households, a sharp contrast from previous years when suppressed renter incomes contributed to a net increase in need. In actual terms, the number of very low-income renter households fell by 198,000 from 2021 to 2023. The drop came entirely from a substantial drop in extremely low-income renters making no more than 30 percent of area median income.
Second, the availability of rental assistance improved. Compared to previous years, a greater share of income-eligible households received assistance. HUD estimates that this smaller rental assistance gap could have decreased the number of worst case needs households by 169,000. This was again a significant difference from the previous two reports when the growing assistance gap was a driver of rising worst case needs.
Assistance continues to fall short of need, but the number of assisted very low-income households rose from 5.1 million in 2021 to 5.4 million in 2023, in part due to emergency assistance programs created during the pandemic. The share receiving assistance also rose by 1.4 percentage points, though the rate of assistance is still just 28 percent among very low-income renters. Extremely low-income households again saw the greatest gains with their assisted share increasing from 33 to 36 percent over this period.
Third, robust overall household formation that could have pushed up worst case needs was offset by a larger share of households becoming homeowners. As a result, renter household formations would have pushed worst case needs up by just 74,000 households in 2021 to 2023, a considerable drop from the 239,000-household contribution in 2019 to 2021. This made household formation a less impactful driver of worst case needs than it was in previous years.
Finally, market dynamics improved slightly for very low-income renters. This driver encompasses all of the forces that affect occupancy rates and rents, which in turn shape the number of homes that are affordable and available to very low-income renters. The shortage of these homes was a smaller factor this year, potentially pushing worst case needs up by an estimated 245,000 households in 2019 to 2021 but by only 196,000 in 2021 to 2023.
Though the recent drop in worst case needs was modest, it is a welcome change following years of increases. Despite this bit of good news, many housing challenges remain. The number of households experiencing worst case housing needs remains near record highs. Additionally, while extremely low-income households have gotten some relief from the worst housing challenges, assistance still does not meet the vast need that exists. Severe housing problems have also risen up the income scale. As a result, an increasing number of unassisted renter households that make no more than 80 percent of area median income (the threshold for low income) are severely cost burdened or live in severely inadequate conditions. This suggests that renter income growth did not fully solve the underlying housing challenges but instead pushed households beyond the very low-income cutoff for having worst case housing needs.
Of note, while the HUD report points to robust immigration and increased competition for rental housing as important factors keeping the number of renters with worst case needs near record levels, a closer examination of the drivers does not support this conclusion. In fact, robust growth in renter households was an important factor in the sharp rise in worst case needs between 2019 and 2021 but was a far less significant factor between 2021 and 2023. Likewise, while competition for low-cost rentals did boost the number of worst case needs between 2021 and 2023, the extent of this competition was actually somewhat less than in 2019 to 2021. The most significant drivers in the more recent period that differed from 2019 to 2021 were greater gains in renter incomes and increases in rental assistance, both of which helped reduce the growth in worst case needs from what it otherwise might have been.


