Ten Takeaways from the 2026 State of the Nation’s Housing

Each year, our State of the Nation’s Housing report offers a snapshot of how US households are faring in finding and affording a place to live. The 2026 report (being released with a livestream today at 4pm ET) reveals a market where activity remains subdued, demand is weakening, and high costs are sidelining many would-be buyers and renters, even as new construction slowly chips away at supply shortfalls. Below are 10 takeaways that underscore both the depth of today’s housing challenges and the urgency of sustained action at all levels of government.
1. Housing activity remains subdued
Many indicators show housing market activity is sluggish through early 2026. Existing home sales still have not rebounded since they hit a 30-year low in 2023 (Figure 1). New home sales levels remain relatively unchanged, rental retention rates increased, and new occupancies declined. Construction starts also slipped 1 percent over the past year, driven by a 7 percent decline in single-family starts.
Figure 1: Home Sales Remain Near Three-Decade Lows
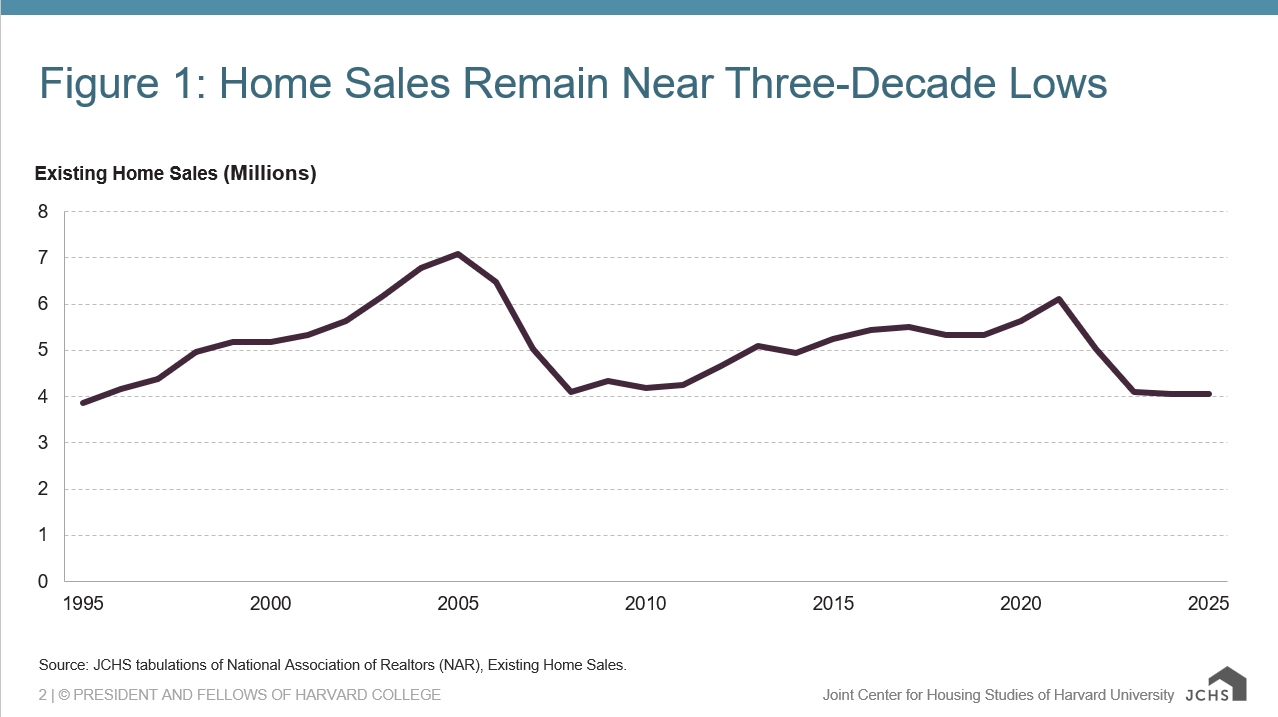
Source: JCHS tabulations of National Association of Realtors (NAR), Existing Home Sales.
2. Weak demand joins supply shortages as a top housing headline
Although supply shortages are still a major concern, depressed demand became a headline in housing over the past year. Annual growth in the number of households was down for the third year in a row in 2025 (Figure 2) and annual growth in the number of homeowner households dropped by half and pushed homeownership rates down for the second straight year. Apartment demand also slowed, with the year-over-year increase in the number of renters in the first quarter of 2026 less than half what it was a year earlier.
Figure 2: Household Growth Is Slowing After Rapid Pandemic-Era Gains
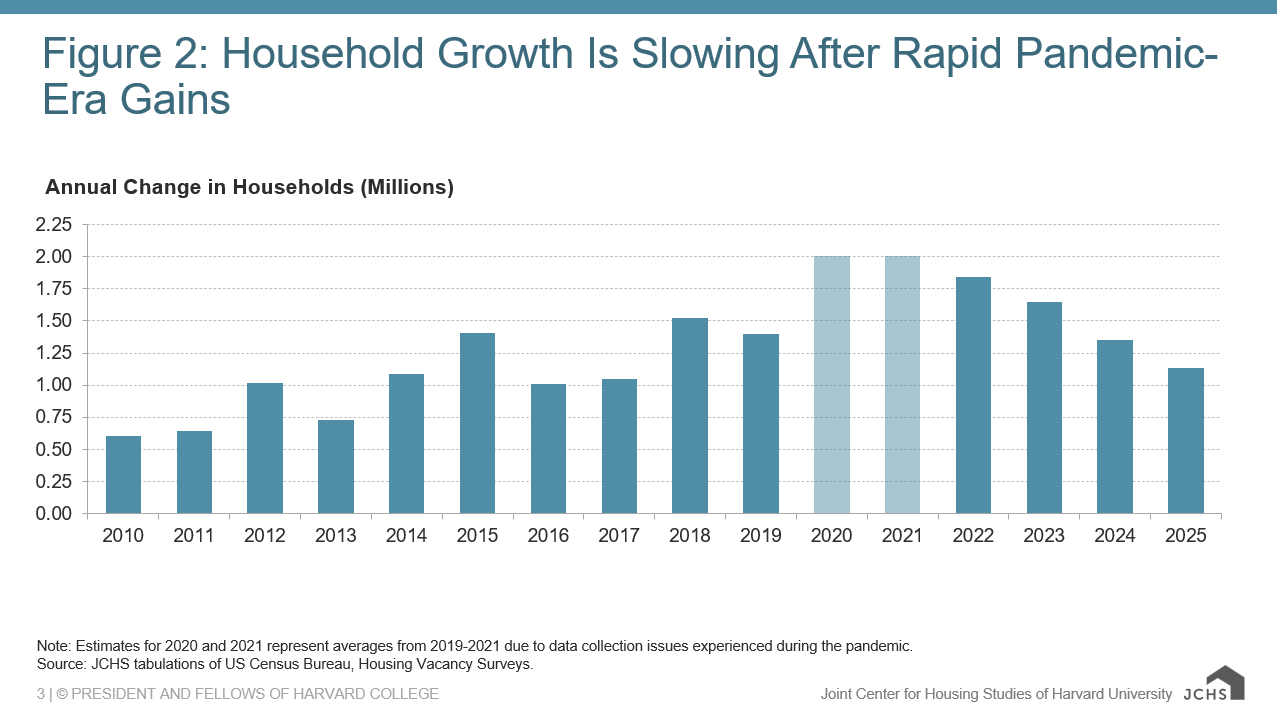
Note: Estimates for 2020 and 2021 represent averages from 2019-2021 due to data collection issues experienced during the pandemic.
Source: JCHS tabulations of US Census Bureau, Housing Vacancy Surveys.
3. Housing demand strained by economic uncertainty
The current weakness in housing demand follows that of several underlying economic drivers. Employment growth dropped precipitously from a gain of 1.5 million in 2024 to an increase of just 116,000 in 2025 (Figure 3). Consumer confidence also dropped by over 20 percentage points throughout 2025, and even further following the start of the conflict in Iran, to an all-time low in April 2026. These were even lower levels than during the 2008 Great Recession or the pandemic. Without a job, graduates are less likely to form a new household or move to a new region. Without confidence in employment, families are less likely to move or make a big purchase like a house.
Figure 3: The Rate of Job Growth Slowed Substantially in 2025
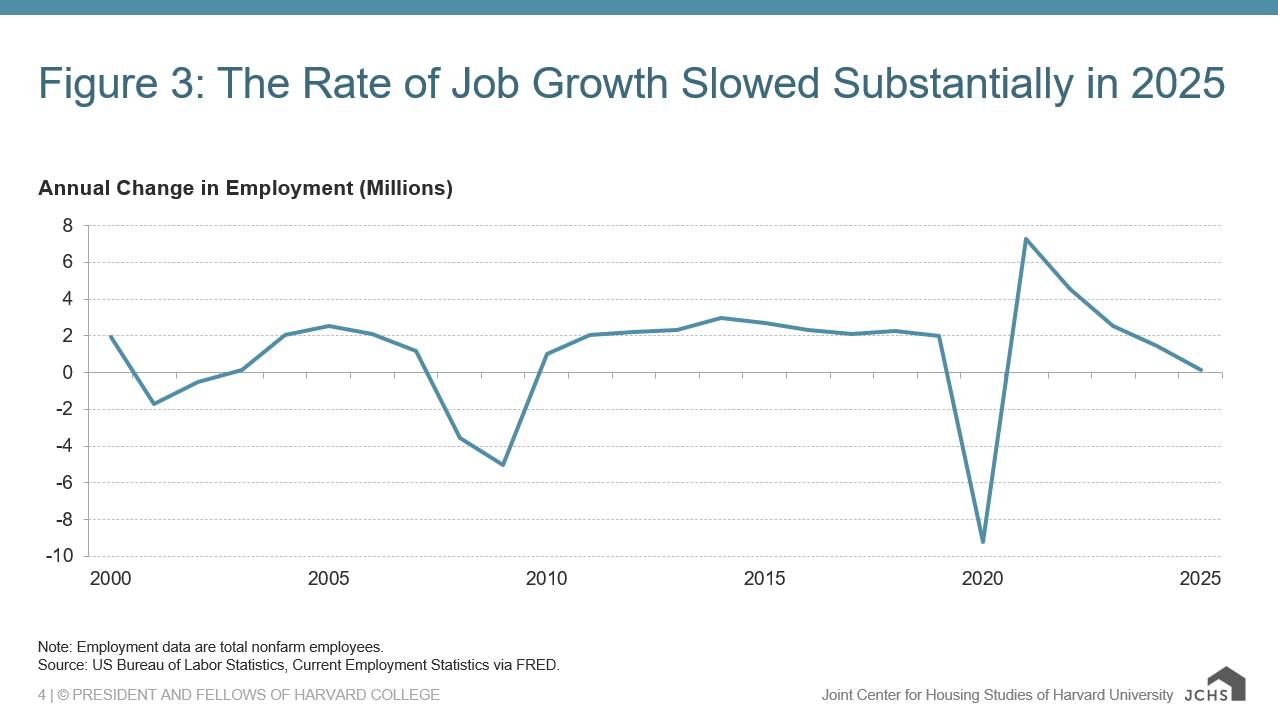
Note: Employment data are total nonfarm employees.
Source: US Bureau of Labor Statistics, Current Employment Statistics via FRED.
4. High housing costs are also depressing demand
Unaffordability is another factor dragging down demand by keeping housing costs out of reach for many households, as high home prices and interest rates keep costs near record highs. Median new and existing home prices are both over $400,000. Existing home prices are up 54 percent nationwide since 2020 and remain nearly 5 times median incomes—far above the standard ratio of 3 that held in the 1990s. Additionally, with interest rates holding over 6 percent, payments on the median-priced home are fully $3,100 in the fourth quarter of 2025, up from $1,700 in early 2020 (Figure 4). Households would need an income of over $120,000 to afford this payment, up from $66,000 in 2020.
Figure 4: Ongoing Homeowner Costs Hover Near Record Highs
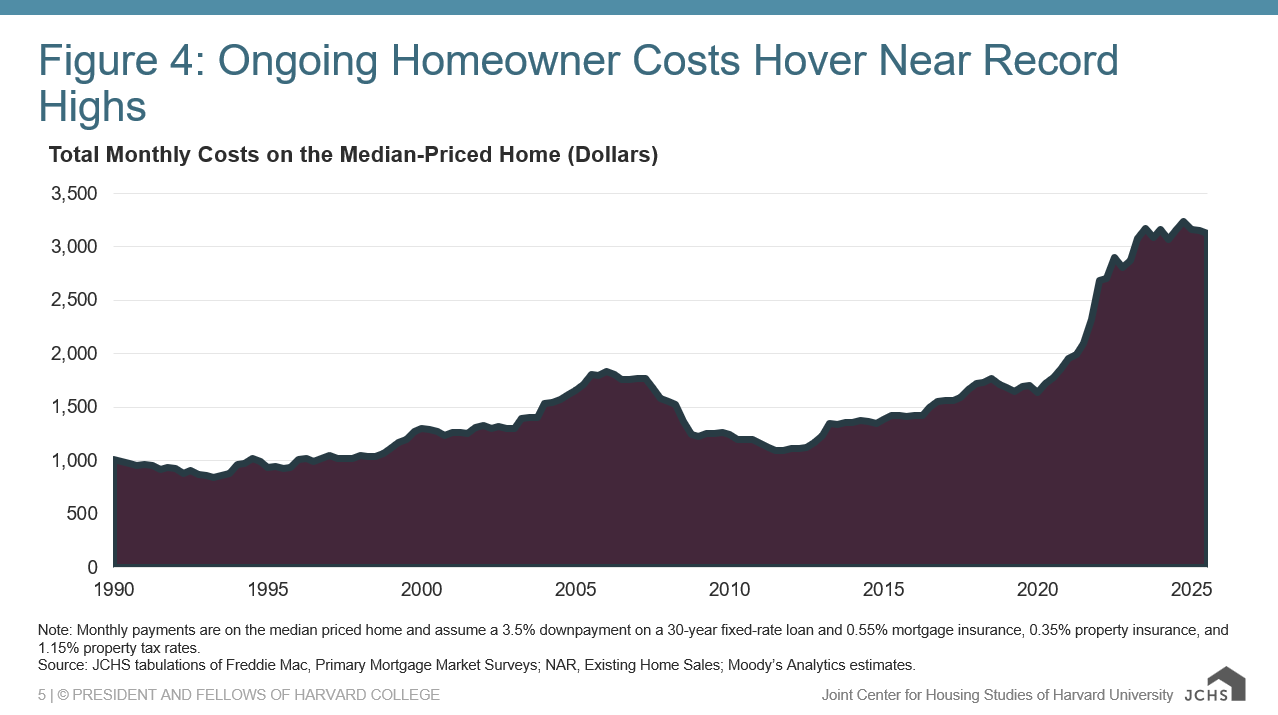
Note: Monthly payments are on the median priced home and assume a 3.5% downpayment on a 30-year fixed-rate loan and 0.55% mortgage insurance, 0.35% property insurance, and 1.15% property tax rates.
Source: JCHS tabulations of Freddie Mac, Primary Mortgage Market Surveys; NAR, Existing Home Sales; Moody’s Analytics estimates.
5. Housing shortfalls continue, but supply is growing
Since 2022, there has been a wave of multifamily construction and steady levels of single-family homebuilding which have lifted vacancy rates from historic lows. The rental vacancy rate has increased from its record low of 5.9 percent in 2022 to 7.3 percent in the first quarter of 2026, while the for-sale vacancy rate has increased from an all-time low of 0.81 percent in 2023 to 1.13 percent (Figure 5). Rates are now closer to average rates from the 1990s, where they held relatively steady at an average of 7.7 percent for rental and 1.6 percent for sale.
Figure 5: Vacancy Rates Have Rebounded From Historic Lows, Particularly for Rental Units
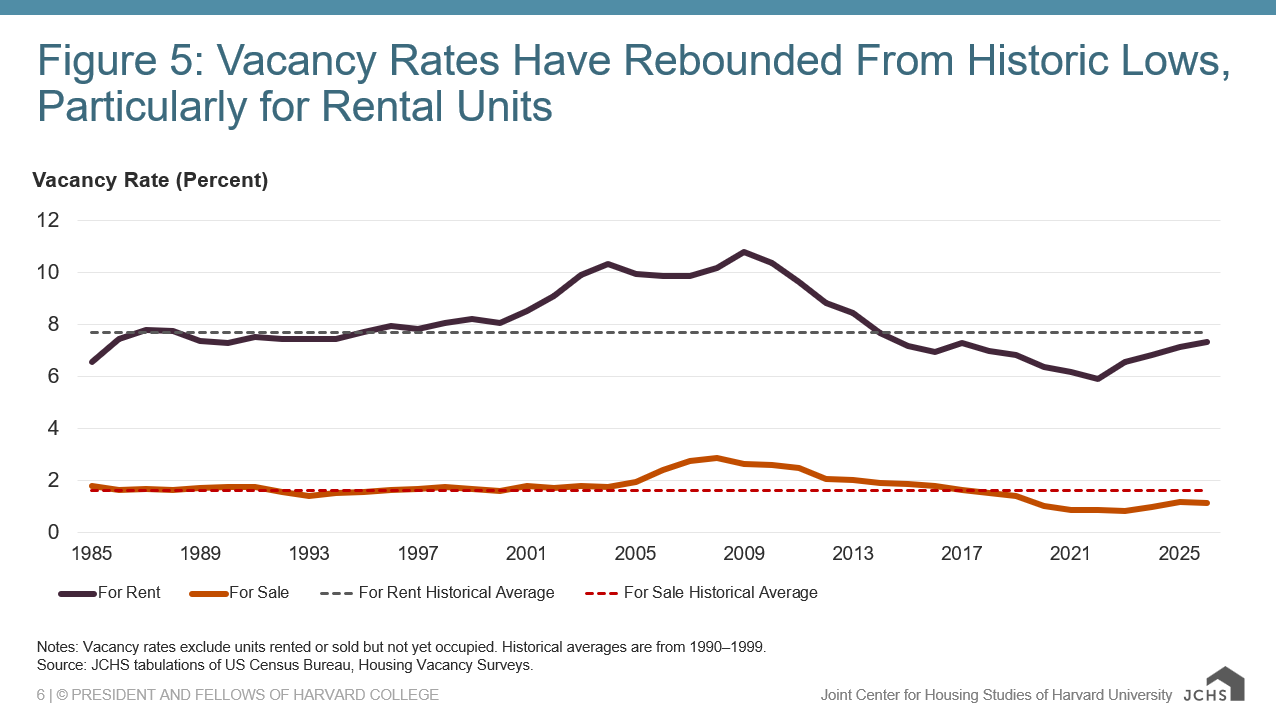
Notes: Vacancy rates exclude units rented or sold but not yet occupied. Historical averages are from 1990–1999.
Source: JCHS tabulations of US Census Bureau, Housing Vacancy Surveys.
6. Supply growth varies by location
Recent gains in supply vary across the country, largely reflecting construction levels. In the Austin metro area—where there has been significant construction—the apartment vacancy rate is up by 5 percentage points since 2021 and for-sale listings nearly tripled. But in the Chicago metro—where construction levels have been more subdued—the apartment vacancy rate is up just 0.5 percentage points during that time, and for-sale listings are down 20 percent.
7. Severe shortages of lower-cost housing remain
Recent gains in housing supply have also been uneven by price point. Growth in the rental stock over the last ten years has been exclusively higher-rent units, while the number of units renting for less than $1,000 (roughly the affordability limit for a household earning $40,000) has declined by 7 million, all lost outright or converted to higher rent (Figure 6). Modestly priced homeownership units are also in short supply: According to NAR/Realtor.com data, the number of homes listed for sale that are affordable to households earning $75,000 or less in March 2026 was down 60 percent from March 2019 levels. But the lowest-income renters face the largest deficit. According to the National Low Income Housing Coalition’s most recent Gap report, 11 million extremely low-income renters compete for just 3.8 million units affordable and available to them, amounting to a gap of 7.2 million units.
Figure 6: The Low-Cost Housing Supply Is Disappearing as the Stock Shifts to Higher Rents
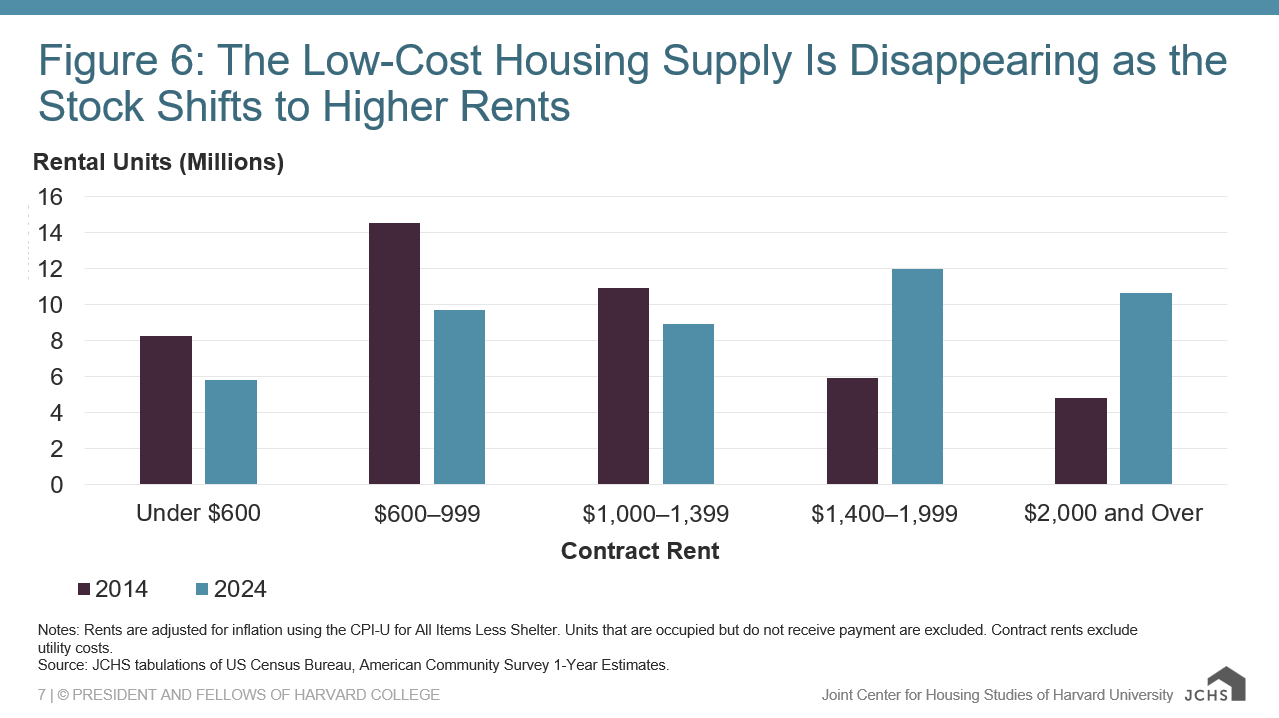
Notes: Rents are adjusted for inflation using the CPI-U for All Items Less Shelter. Units that are occupied but do not receive payment are excluded. Contract rents exclude utility costs.
Source: JCHS tabulations of US Census Bureau, American Community Survey 1-Year Estimates.
8. Cost burdens remain at crisis level for lowest income households
Extreme shortages of low-cost housing are also evident in the high shares of households burdened by unaffordable housing costs. The number of renters with cost burdens reached a new record high at last measure in 2024. Cost burdens are on the rise even for lower-income households where rates are already sky high, with 83 percent of renters earning under $30,000 per year spending more than 30 percent of incomes on housing, and fully 66 percent paying more than 50 percent of incomes on housing (Figure 7). Low-income homeowners also have record-high rates of burden, along with rising insurance rates and property taxes, energy and utility costs, and inflation.
Figure 7: Renter Affordability Has Worsened Across the Income Scale
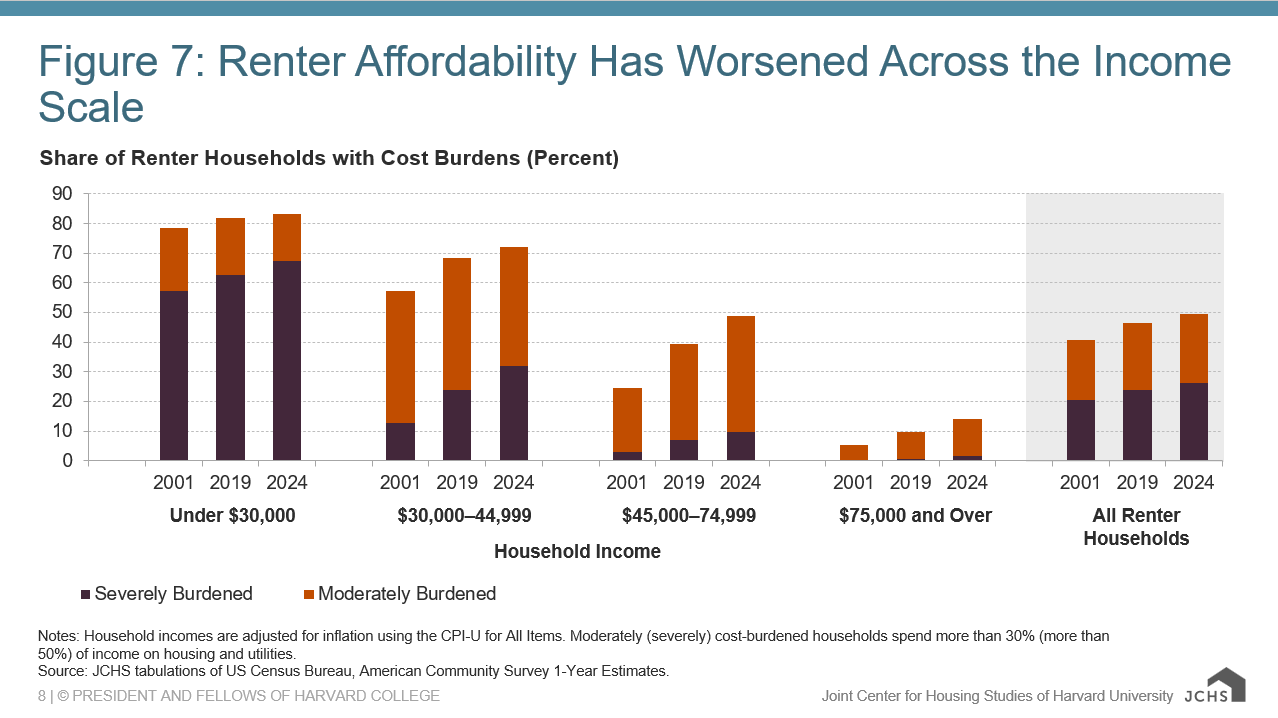
Notes: Household incomes are adjusted for inflation using the CPI-U for All Items. Moderately (severely) cost-burdened households spend more than 30% (more than 50%) of income on housing and utilities.
Source: JCHS tabulations of US Census Bureau, American Community Survey 1-Year Estimates.
9. High housing costs leave millions with little to spend on other necessities
Forced to spend so much income on housing, millions of low-income households have little to spend on all other necessities. After paying for housing, the 13 million renter households earning less than $30,000 had a median of just $210 per month left to spend on all other necessities (Figure 8). Even after adjusting for inflation, this is down sharply from an already-low $410 of residual income for this group in 2019. Meanwhile, inflation has driven up non-housing costs sharply, further reducing the ability to support a household with such meager remaining funds.
Figure 8: Lower-Income Renters Have Little Left Over After Paying for Housing
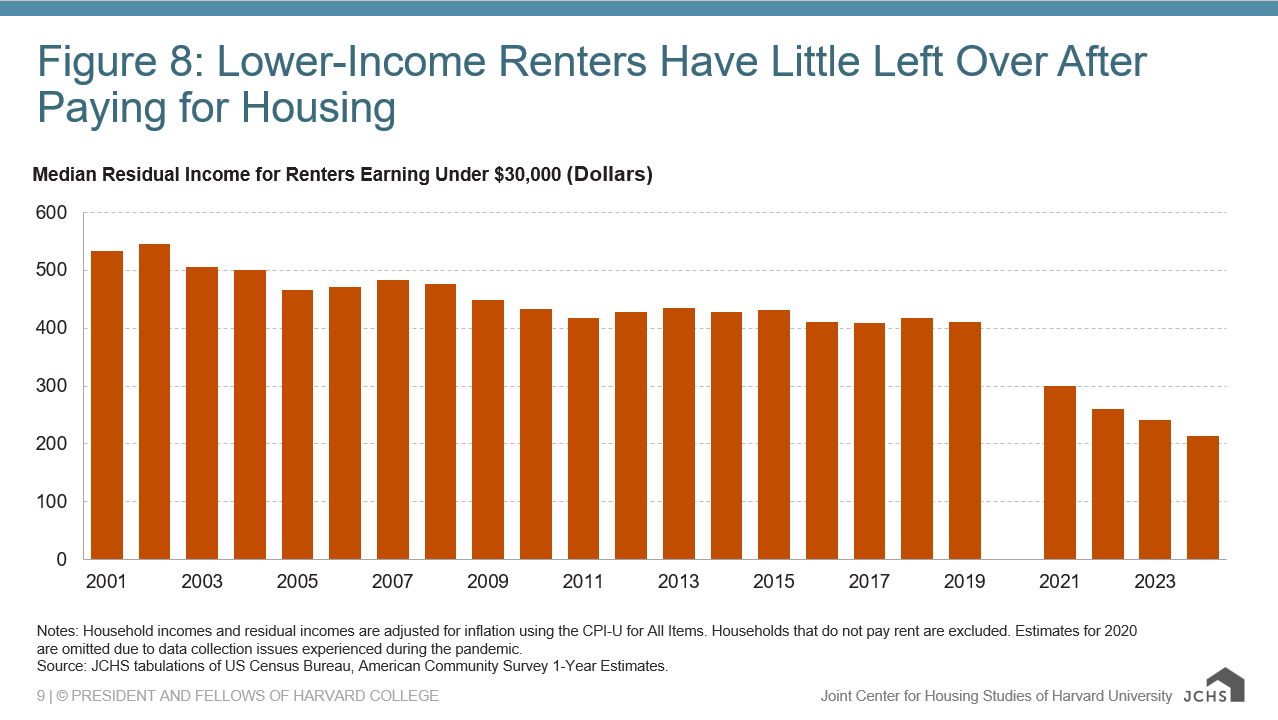
Notes: Household incomes and residual incomes are adjusted for inflation using the CPI-U for All Items. Households that do not pay rent are excluded. Estimates for 2020 are omitted due to data collection issues experienced during the pandemic.
Source: JCHS tabulations of US Census Bureau, American Community Survey 1-Year Estimates.
10. Growing momentum for government policies to boost supply and affordability
With millions burdened by high housing costs, growing numbers of state and local governments are taking action to increase housing production (Figure 9). The report highlights several states and local jurisdictions across the country who are removing regulatory barriers and adding locally run financial interventions such as revolving construction loans.
Figure 9: State Reforms in 2025 to Promote Residential Development
| Regulatory Change | States |
|---|---|
| Allow accessory dwelling units (ADUs) in single-family zones | Arkansas, Iowa |
| Allow new manufactured homes in single-family zones | Kentucky |
| Allow multifamily housing in commercial zones | Florida, New Hampshire, Texas |
| Establish objective criteria for project approvals | Tennessee |
| Permit single stairwells in midrise buildings | Colorado, New Hampshire, Montana |
Some positive federal-level actions have also occurred, most notably with the increase in Low-Income Housing Tax Credit funding and the ongoing discussions associated with the 21st Century ROAD to Housing Act. But more support will be needed to increase the affordability and availability of housing for low- and moderate-income households given the high level of need documented in this year’s report.


