Many Owners Cannot Afford to Maintain Aging Homes

Keeping the nation’s aging housing stock in sound condition demands growing investment. New analysis of the American Housing Survey (AHS) finds that while spending on improvements and repairs rises as homes age, the capacity to meet that need differs sharply by income. Among owners of homes built before 1960, those in the highest income quintile spent three times as much on improvements and repairs in 2023 as those in the lowest. Though the oldest homes need significant investment, they are disproportionately occupied by owners with the least financial capacity to make repairs.
The housing stock is the oldest on record. In 2023, the housing stock reached a median age of 44 years, up from 39 years in 2013, and 28 years in 1993. A prolonged period of underbuilding during the Great Recession meant that far fewer new homes were added to the stock compared to previous decades. At the same time, stricter building codes as well as innovations in construction materials and techniques have extended the lifespan of homes, keeping them in the stock for longer. Together, these trends have increased the average age of the housing inventory. In 2023, one in four homeowners (22 million households) lived in a home built before 1960.
The age of a home shapes the composition of home improvement and repair spending. As homes age, and components and systems wear with time and use, homeowner improvement and repair expenditure shifts towards maintenance and replacement projects (Figure 1). In 2023, home maintenance accounted for 22 percent of total remodeling and repair expenditure on homes built before 1960, compared to just 16 percent of spending on homes built in 2010 or later. Replacement projects such as roofing, siding, windows, insulation, and HVAC are difficult to defer as they are often essential to maintain safe and decent conditions. Taken together, replacements of exterior and interior home components, systems, and equipment accounted for 39 percent of homeowners’ spending on homes built before 1960, far above the 24 percent share for homes built in 2010 or later. On the other hand, outside property improvements such as fencing, landscaping, and recreational structures (sheds, pools) accounted for a third of total remodeling and repair investment in newer homes, more than triple the 10 percent share for pre-1960 homes. Room additions and outside attachments such as porches were also a bigger focus of investment in newer homes, at 15 percent, compared to just 8 percent of remodeling and repair investment in older homes.
Figure 1: Owners of Older Homes Focus Their Spending on Maintenance and Replacements

Notes: Project categories are aggregations of the detailed projects reported in the AHS. See Table A-1 of Improving America’s Housing for definitions of improvement project categories.
Source: JCHS tabulations of HUD, 2023 American Housing Survey.
These shifting priorities in project types also show up in how much homeowners spend as their homes get older. Average improvement and repair spending increases considerably as homes age past 20 years, and remains elevated as core components and systems cycle through their useful lives. In 2023, owners living in homes built before 1960 spent an average of $6,000 on improvements and maintenance, about 35 percent more than the $4,500 average for homes built in 2010 or later. This pattern holds across income levels, with homeowners at all income levels spending more on average on older homes than newer ones.
Although homes need continuous reinvestment to replace worn or broken components, upgrade inefficient equipment, and counteract deterioration, many households lack the resources to address these needs. Among homeowners living in pre-1960 homes, owners in the highest income quintile spent an average of $12,700 on improvements and repairs in 2023, three times the $3,400 average for owners in the lowest income quintile (Figure 2). Regardless of building age, higher-income homeowners consistently outspend lower-income owners on home improvements and repairs. Indeed, lower-income homeowners in the oldest homes spent less than higher-income owners living in the newest homes, even though newer homes are earlier in their replacement cycles and less likely to need major repairs. In 2023, higher-income owners spent an average of $7,400 on homes built since 2010, more than double the average spending of lower-income owners in homes built before 1960.
Figure 2: Regardless of Building Age, Higher Income Homeowners Outspend Lower-Income Owners on Remodeling and Repairs
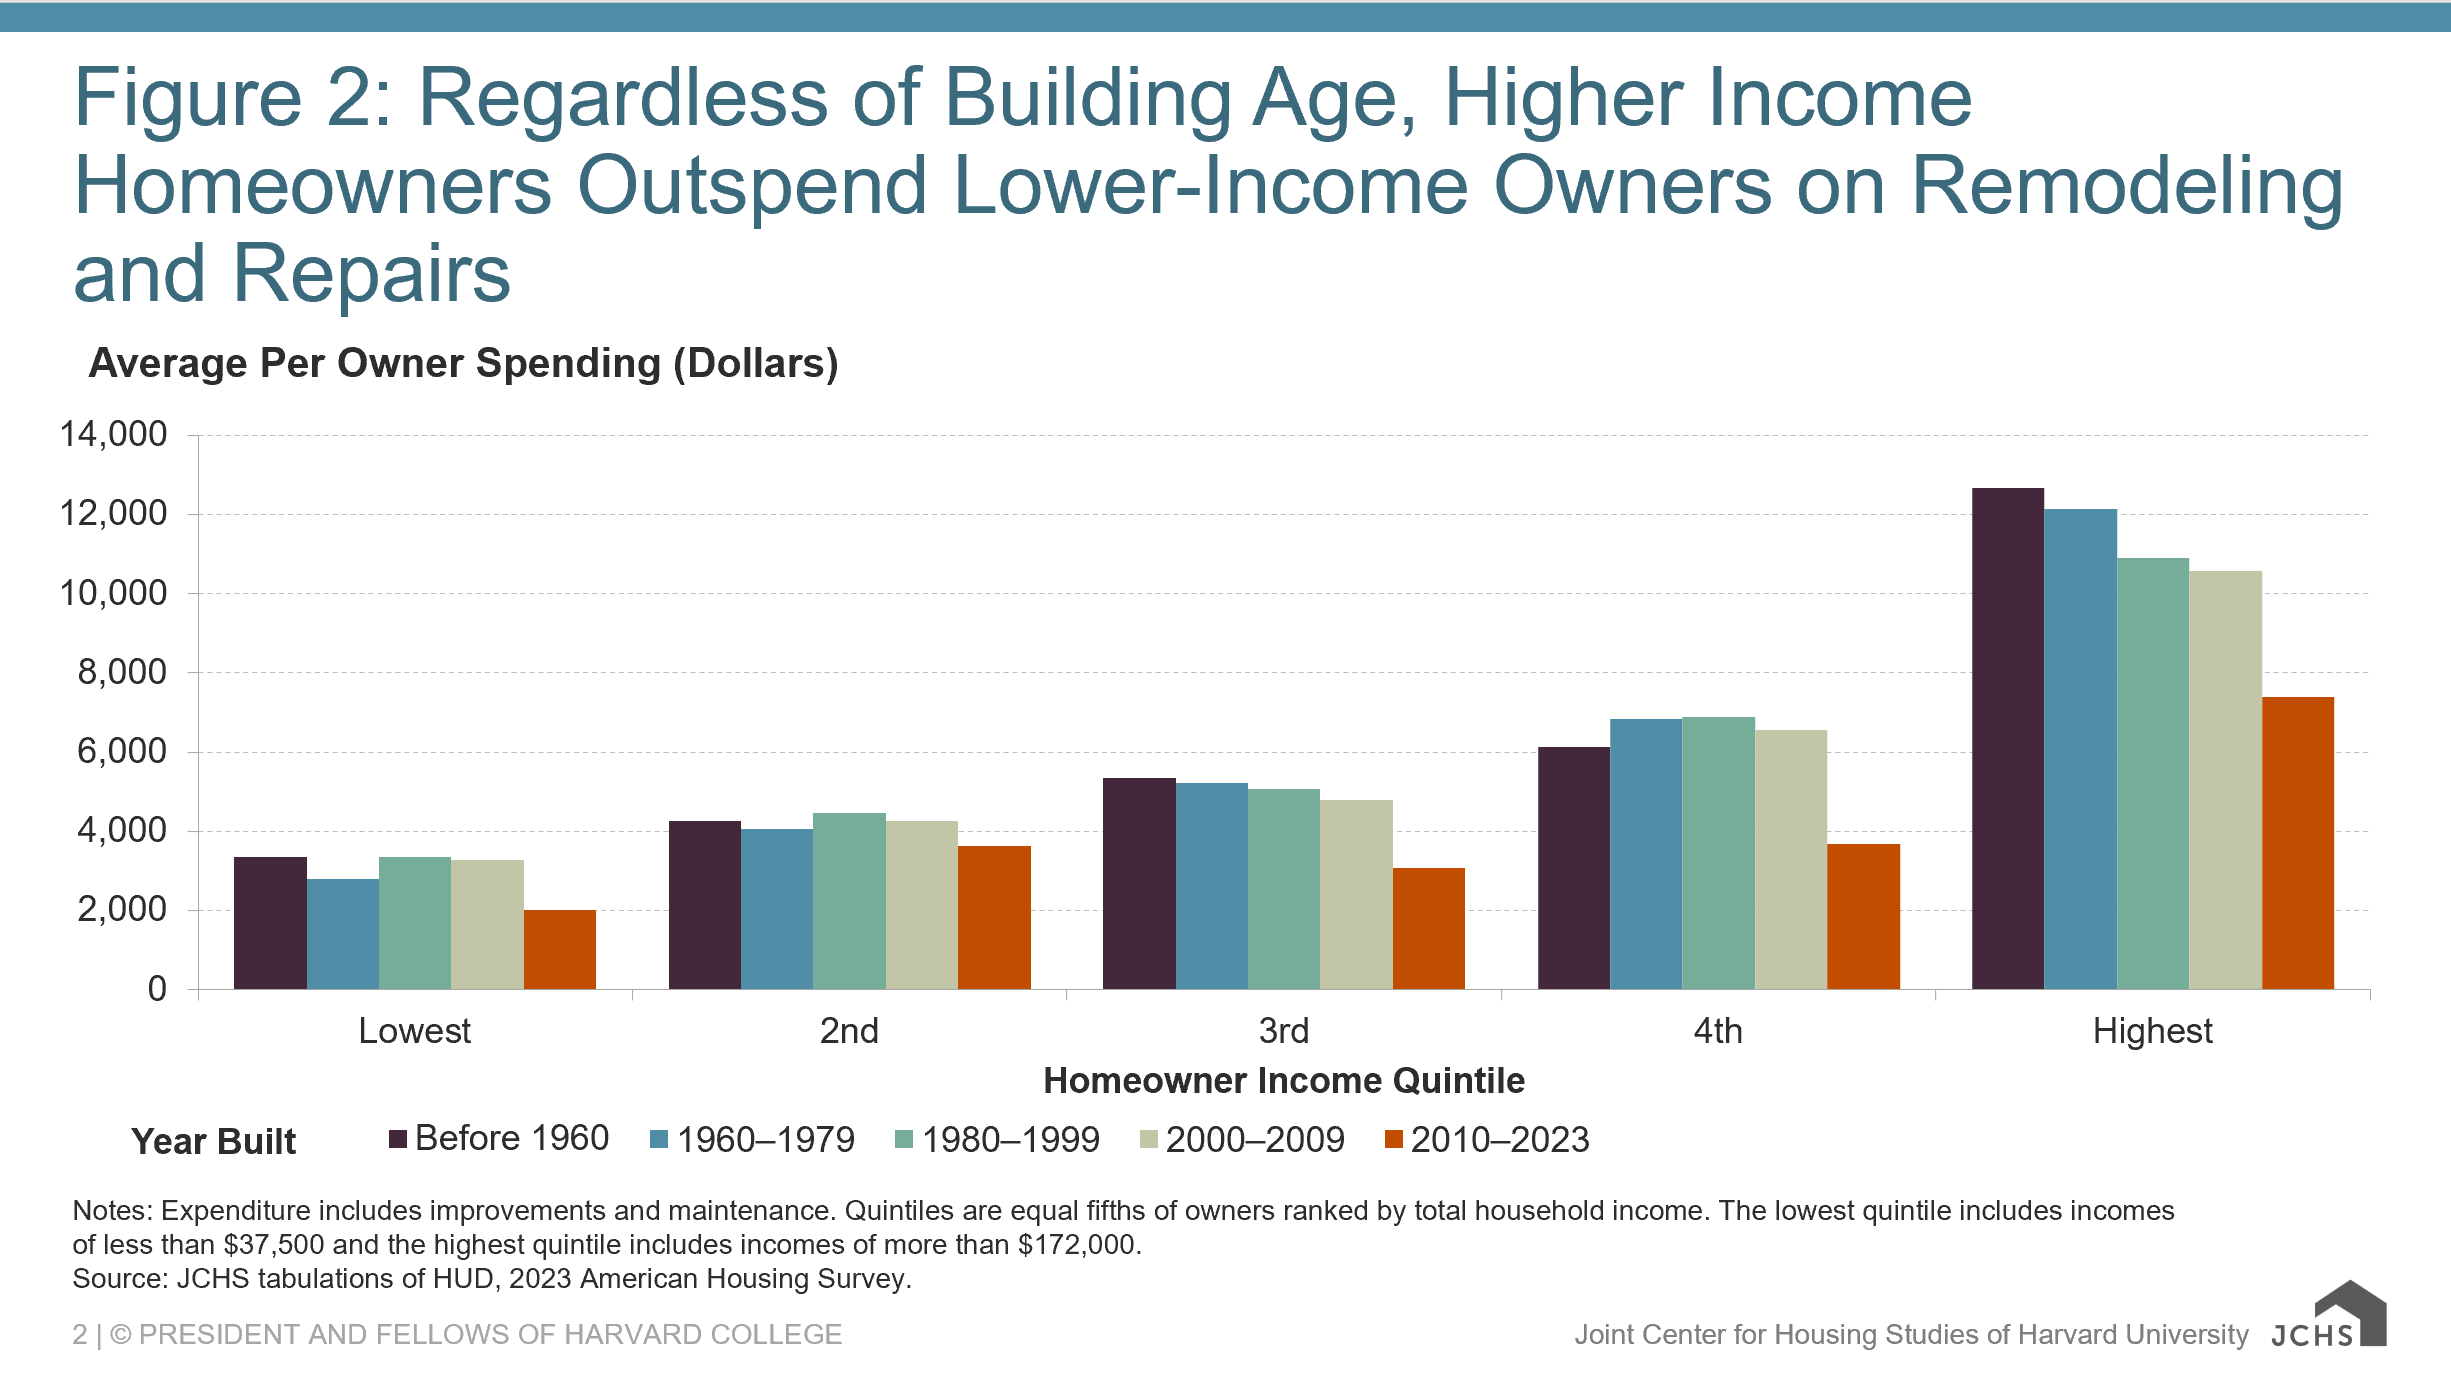
Notes: Expenditure includes improvements and maintenance. Quintiles are equal fifths of owners ranked by total household income. The lowest quintile includes incomes of less than $37,500 and the highest quintile includes incomes of more than $172,000.
Source: JCHS tabulations of HUD, 2023 American Housing Survey.
The inability of many homeowners to maintain aging housing has contributed to deterioration and disrepair. Older homes are by far the most likely to fall short of habitability and suitability standards (Figure 3). In 2023, 2.9 million homeowner households (3.3 percent) lived in units classified by HUD as moderately or severely inadequate, with multiple structural deficiencies such as water leaks, large open cracks, and holes in the floor, or serious problems with basic features such as plumbing, electrical, or heating. Homes built before 1960 were the most likely to be classified as inadequate, at 5.4 percent, four times the 1.3 percent rate for owner-occupied homes built in 2010 or later. Even among homes that meet adequacy standards, repair needs are widespread. A 2025 report by the Federal Reserve Bank of Philadelphia estimated that 48 percent of owner-occupied housing built before 1940 needed at least one repair in 2024, far above the 26 percent of homes built in 2000 or later. Older owner-occupied homes also carried a higher average estimated repair cost, at $5,200 per unit, compared to $3,600 for newer homes. The collective cost to repair owner-occupied homes built before 1940 was an estimated $23.9 billion.
Figure 3: The Oldest Homes Are the Most Likely to Be Physically Inadequate
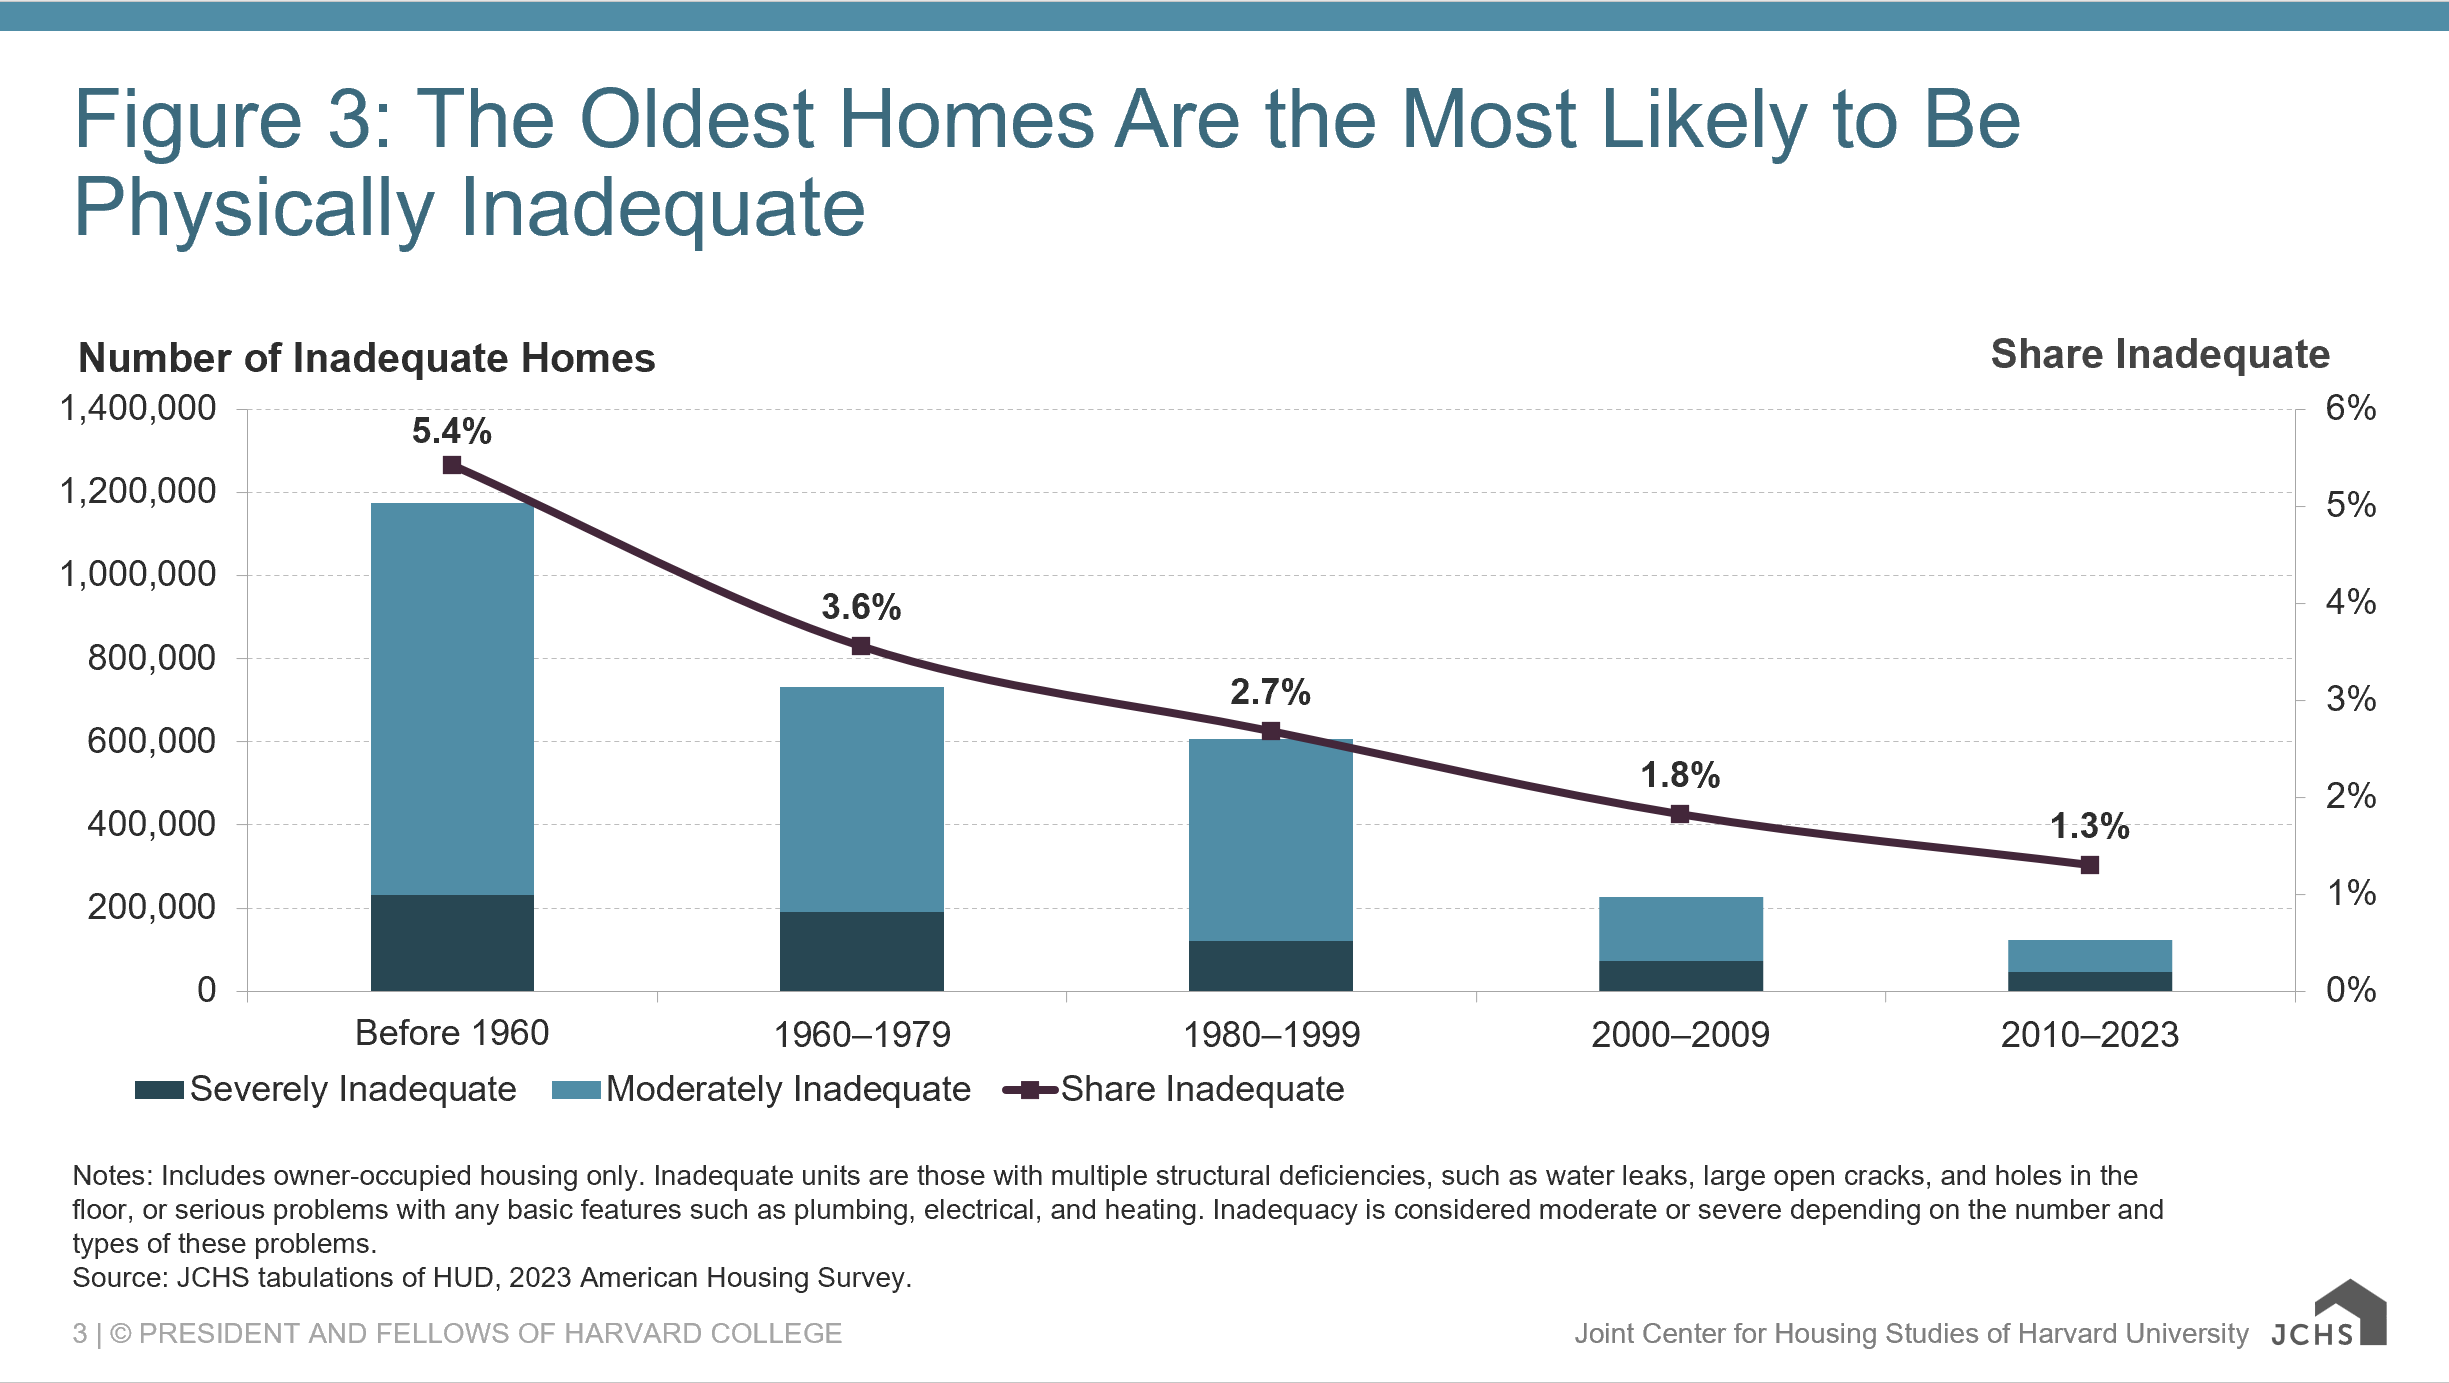
Notes: Includes owner-occupied housing only. Inadequate units are those with multiple structural deficiencies, such as water leaks, large open cracks, and holes in the floor, or serious problems with any basic features such as plumbing, electrical, and heating. Inadequacy is considered moderate or severe depending on the number and types of these problems.
Source: JCHS tabulations of HUD, 2023 American Housing Survey.
Preserving the aging stock is essential to sustaining lower-income homeownership. Because older homes tend to have lower values, they make up a disproportionate share of the housing options available to lower-income households. In 2023, 29 percent of homeowners in the lowest income quintile lived in a home built before 1960. For these owners, falling behind on upkeep is costly on several fronts. Unmet repairs accumulate and grow more expensive over time and can escalate into emergencies that threaten a household’s immediate financial stability. Underinvestment erodes a home’s value, limiting owners’ ability to build wealth. Deterioration also exposes residents to health and safety hazards, including lead, mold, fire risks from faulty wiring, injuries from structural deficiencies, and unsafe indoor temperatures.
Recent legislative efforts have begun to respond to the repair needs of the aging housing stock. In 2023, Pennsylvania’s Whole-Home Repairs Program became the first statewide initiative to subsidize repair costs for lower-income homeowners and rental property owners. At the federal level, the 21st Century ROAD to Housing Act establishes a pilot program that provides grants for income-eligible homeowners for habitability, safety, accessibility, and weatherization repairs. Current funding remains low relative to an aggregate repair need that, for the oldest homes alone, runs into the tens of billions of dollars. Closing that gap will require sustained commitment directed to the owners and homes where the need is greatest.


