Who is Moving and Why? Seven Questions about Residential Mobility
Packing boxes and moving trucks are a familiar experience for nearly everyone, whether their most recent move was last year or ten years ago. Americans have been moving much less than they did in the past, however, and I explore that trend in a new research brief released today. To accompany the brief, below are seven questions about residential mobility, providing a macro-level view of this universal activity. Due to the fact that the most recent mobility data are from 2019, I do not cover the effects of the COVID-19 pandemic on mobility, but I discuss a few possible implications below.
1. How many Americans move each year?
For the past five years, just over 40 million Americans moved each year, according to American Community Survey (ACS) data. That calculates to about 13 percent of Americans moving each year.
2. What is the most common type of move?
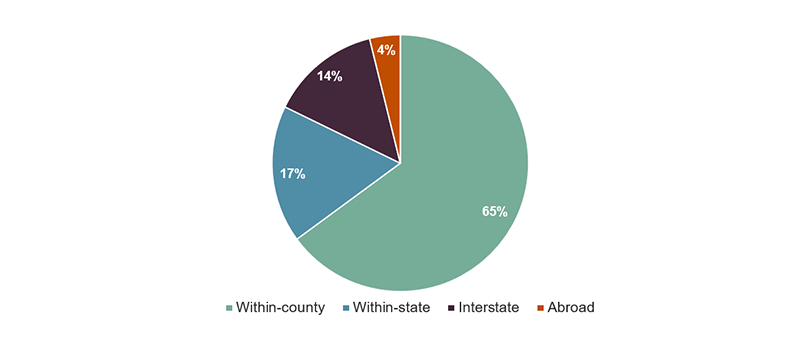
Most moves are local, either within the same county or within the same state. Within-county moves accounted for 65 percent of all moves in 2019, while moves between counties in the same state accounted for 17 percent, according to Current Population Survey (CPS) data. 14 percent of moves were across state lines in 2019 and moves from outside the country only accounted for 4 percent of all moves (Figure 1).
Figure 1: The Vast Majority of Moves Are Local
Notes: Person-level data for persons 1+ years old. Movers are defined as those who moved in the past year. Within-state moves are between counties in the same state. Excludes group quarters and imputed mobility numbers.
Source: JCHS tabulations of US Census Bureau, 2019 Current Population Survey via IPUMS-CPS, University of Minnesota.
3. Why do people move?
People move for a variety of reasons, but the most common motivator is housing. According to the CPS, which contains a question about the primary motivation for moving, 40 percent of movers did so for housing-related reasons in 2019, 27 percent moved for family-related reasons, 21 percent for job-related reasons, and 12 percent for other reasons. This breaks down differently by type of move, however. Local moves are primarily motivated by housing, but long-distance moves are primarily motivated by jobs. The only exception is for older Americans, who make long-distance moves for family-related reasons more than job-related reasons.
4. Where do people move?
Although interstate migration accounts for less than one-fifth of all moves, this type of move is worth considering because of its important implications for regional demographic and economic change. Sunbelt states are particularly popular for interstate migrants, with Florida and Texas leading the pack, both gaining on average over 100,000 people per year since 2010. In recent years, the Pacific Northwest and other western states, most notably Colorado, have been attracting large numbers of migrants as well. While many Americans move to the Midwest and Northeast, more Americans move out of these regions each year, leaving those states with negative net flows of domestic migration. This does not necessarily equate to population loss, however, as immigration and natural population growth frequently offset any loss in domestic migrants (as I noted in a blog post about county-level mobility trends earlier this year).
5. Are Americans moving more or less than in the past?
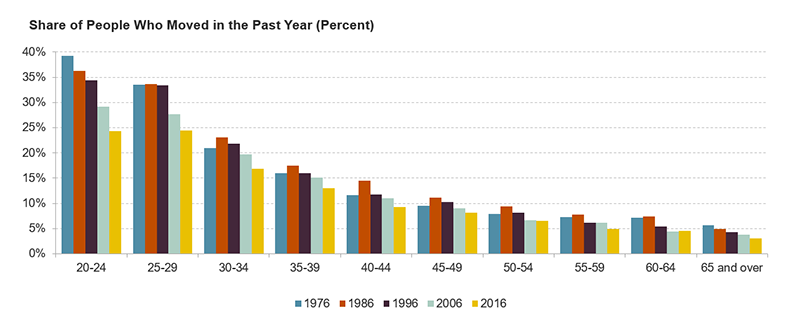
Mobility rates are about half what they were in the 1940s—when one in five Americans moved each year—and have been steadily declining since the mid-1980s. Local moves have been declining the most, especially among young adults, but all age groups have been moving less than in the past (Figure 2). Interstate migration has also declined substantially, but these rates seem to have stabilized since 2010 (as detailed in a 2018 blog post about interstate migration trends).
Figure 2: Mobility Decline Is Sharpest Among Young Adults, Across Generations
Notes: Person-level data for persons 1+ years old. Excludes group quarters and imputed values from 1996-2016.
Source: JCHS tabulations of US Census Bureau, Current Population Surveys via IPUMS-CPS, University of Minnesota.
6. Why are Americans moving less than in the past?
There is little consensus as to why Americans are moving less, but three factors that seem to be playing a role are demographic change, housing affordability, and changes in labor dynamics. People move less often as they age, and as millennials (America’s second-largest generation) age out of their most mobile years, some decline in mobility should be expected. The housing affordability crisis (discussed in detail in our recent report) could also be depressing mobility, with high costs discouraging moves into unaffordable areas. Lastly, the rise in dual-earner households, as well as increases in rates of working from home (especially during and possibly after the COVID-19 pandemic) could also be having a downward effect on mobility, as both dual-earner households and remote workers have lower mobility rates than single-earner households and commuters.
7. How might the COVID-19 pandemic affect mobility?
Since the COVID-19 pandemic is still unfolding, it is difficult to assess its possible impacts on mobility. It could be that mobility is going to spike after the quarantines end and people move to cheaper housing (if available) after losing income from a job loss. Mobility could also spike as a result of evictions or foreclosures if substantial payment assistance is not provided before the temporary bans on evictions and foreclosures end. It could also be that mobility will decline further as people become less likely to buy or sell homes, especially during the quarantines but also afterwards due to higher economic uncertainty. Working from home is likely at record high levels right now, and if even a small portion of this shift proves to be permanent, it could mean fewer people moving for job-related reasons as well.


