Where Hasn’t Housing Construction Kept Pace with Demand?
For much of the past decade, new housing construction has barely kept pace with the growth in housing demand, particularly in western states, according to our latest State of the Nation’s Housing report. From 2010-2018, annual construction nearly equaled year-to-year household growth. During that period, 8.35 million new households formed and 8.35 million new housing units were built—including housing completions and placements of manufactured homes. In other words, for every 100 new households formed on net, about 100 housing units were added to the stock (Figure 1).
Relative to historic norms, this level of production indicates a severe shortage in new housing. Since the mid-1970s, the construction industry has produced nearly 130 new units on average for every 100 households formed. This margin accounts for the replacement of older housing units that are demolished or converted to other uses, geographic shifts in the population across markets, and a natural amount of vacancy required for a well-functioning housing market. Our latest household projections, for example, estimate that annual growth of 1.2 million households over the next decade—equivalent to current levels—would support demand for the construction of 1.5 million new units, well above the 1.2 million units produced last year.
Figure 1: Housing Construction Has Just Kept Pace with Household Growth for an Unprecedented Eight Years
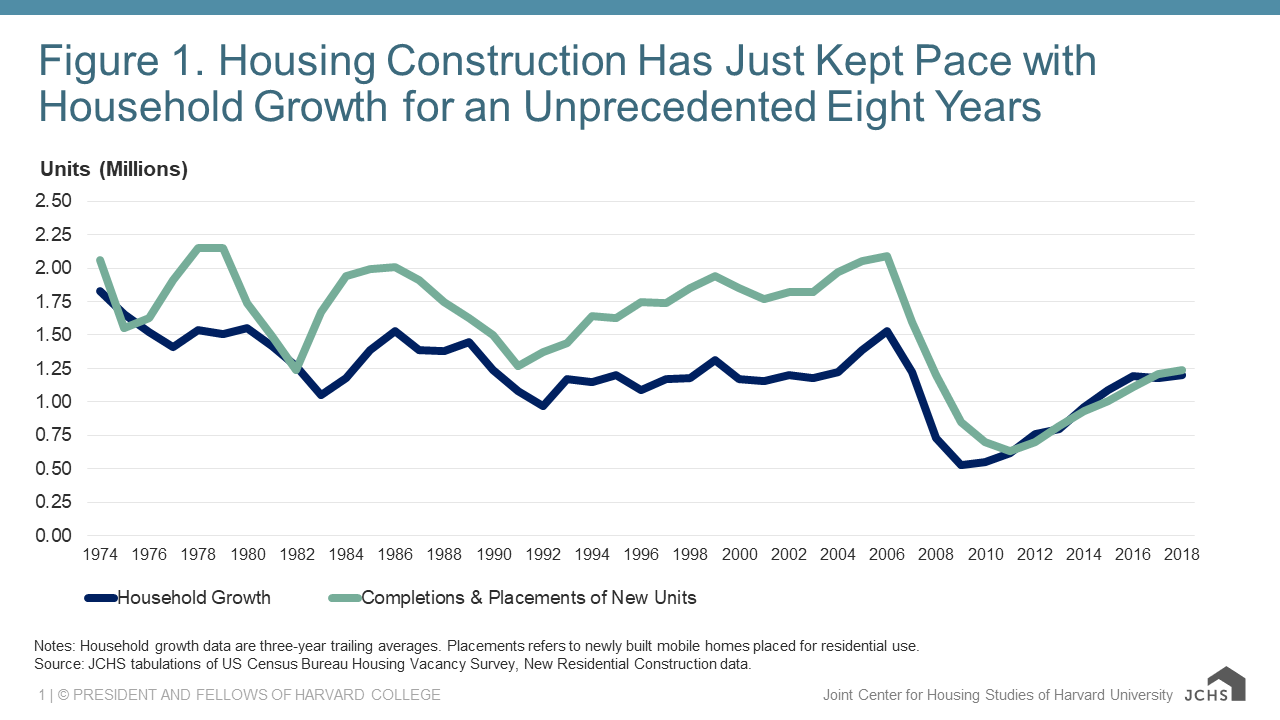
Notes: Household growth data are three-year trailing averages. Placements refers to newly built mobile homes placed for residential use.
Source: JCHS tabulations of US Census Bureau Housing Vacancy Survey, New Residential Construction data.
Persistently low production levels put significant pressure on housing markets, but the shortfall has differed tremendously across the country. Using available metro area data on housing permits and household growth between 2007 and 2017, we show that construction relative to demand has generally been most robust in the South and most restricted in the West. Excluding the 15 markets where household growth was under 3 percent, fewer than 100 housing permits were issued for every 100 households added on net in 19 of the remaining top 100 housing markets. These include only 3 of 37 Southern markets (8 percent), 3 of 13 markets in the Midwest (23 percent), 4 of 12 in the Northeast (33 percent), and 9 of 23 markets in the West (39 percent) (Figure 2). Indeed, local governments in 29 markets issued at least 130 permits per 100 households added and none were in the West. By comparison, 19 were in the South, 6 in the Northeast, and 4 were in the Midwest (Figure 3).
Of the 19 markets where household growth exceeded new construction, 9 were among the 50 largest metro areas, including New Orleans—an aberration because of the significant amount of household growth that occurred in the aftermath of Hurricane Katrina in 2005. Aside from New Orleans, San Francisco had the mildest construction response among the nation’s largest markets relative to demand with 79 permits issued per 100 new households, followed by San Antonio (80), Boston (81), Sacramento (88), Columbus (89), San Diego (94), Denver (97), and Phoenix (99).
Figure 2: New Construction Was Especially Constrained in the West from 2007 to 2017
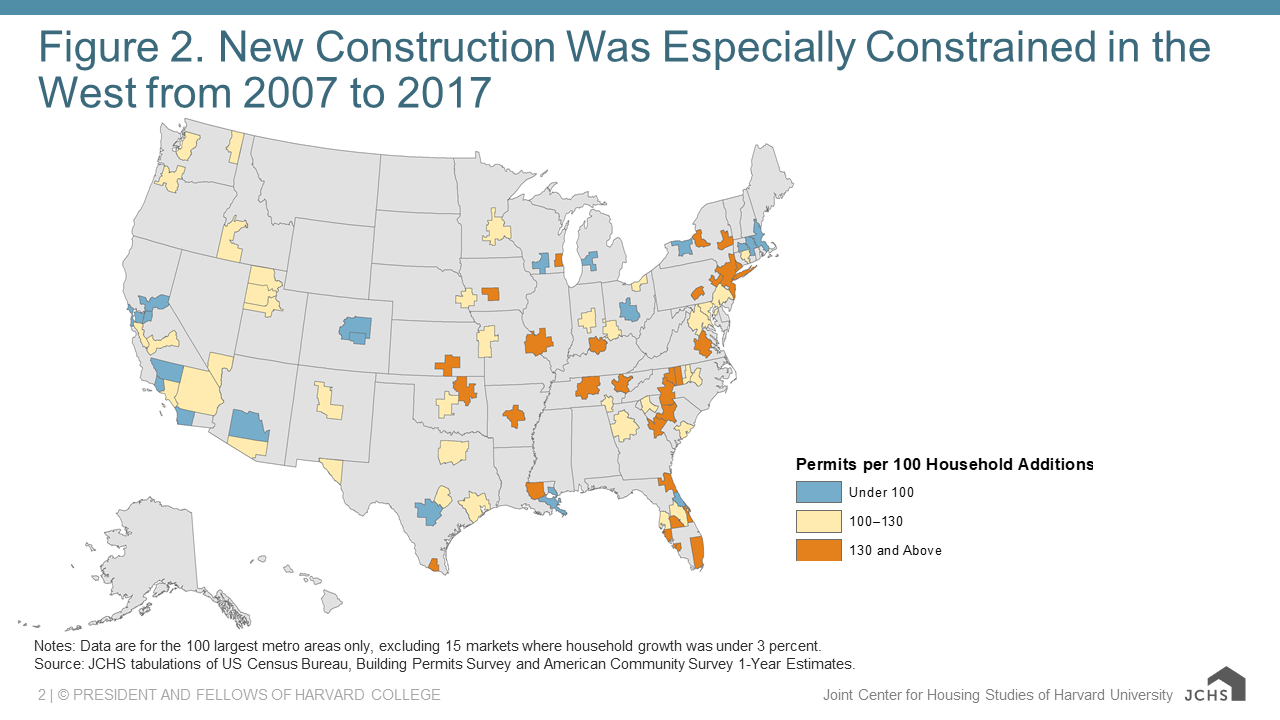
Notes: Data are for the 100 largest metro areas only, excluding 15 markets where household growth was under 3 percent.
Source: JCHS tabulations of US Census Bureau, Building Permits Survey and American Community Survey 1-Year Estimates.
Vacancy rates can shed some light on the extent of the undersupply. Markets like San Francisco, San Diego, and Boston were already supply constrained and became even tighter. In those markets, the vacancy rate was between 7.4 and 7.8 percent in 2007, well below the top 50 average of 9.9 percent. By 2017, the vacancy rate declined between 0.5 percentage point in San Diego and 1.4 percentage point in San Francisco, exacerbating the already tight supply of available homes.
In other markets, vacancy rates were relatively high and have since normalized given the lack of construction. In Columbus and San Antonio, for example, vacancy rates were 11.5 percent and 10.4 percent, respectively, in 2007. Rapid household growth in these markets wasn’t accompanied by a robust supply response, in part because the existing stock was able to accommodate that growth. Instead, vacancy rates in both markets fell to 8.4 percent in Columbus and 9.6 percent in San Antonio—rates more in-line with national averages (9.2 percent among the top 50 metros).
Figure 3: Housing Construction Did Not Keep Up with Household Growth in Many Metros of the West and Northeast
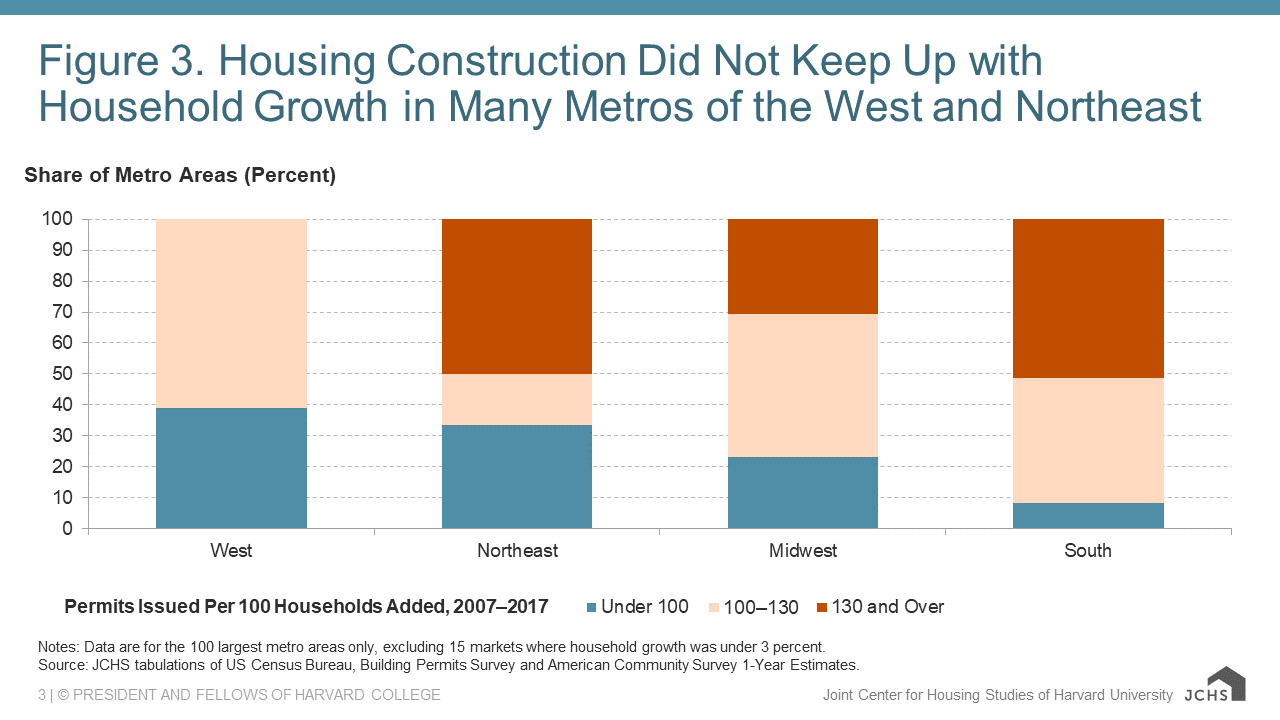
Notes: Data are for the 100 largest metro areas only, excluding 15 markets where household growth was under 3 percent.
Source: JCHS tabulations of US Census Bureau, Building Permits Survey and American Community Survey 1-Year Estimates.
On the other hand, new construction was robust relative to household growth in St. Louis (217 permits per 100 households added), New York (182), Richmond (173), Jacksonville (171), Louisville (152), and Miami (146). As a result, vacancy rates in these markets were relatively flat on average, increasing by under 1 percentage point in St. Louis and New York and declining slightly in the four other metro areas.
Some caution, however, needs to be used in interpreting these numbers. The simple measure we’ve created here—the ratio of housing permits to household growth—isn’t meant to capture the full complexity inherent in supply and demand. For example, the amount of household growth is, in part, limited by the ability of the market to deliver new housing supply, making household growth an imperfect measure of housing demand. Moreover, the precise ratio discussed—130 (or 100) permits issued per 100 new households—is simply a rule of thumb based on long-run national averages. The amount of new supply needed to keep markets in balance at the metro level will vary from one metro area to another, depending on the age and quality of the stock, the vacancy rate, and the number of units needing replacement. Lastly, the permits data themselves are imperfect measures of new supply because they exclude manufactured housing and not all units permitted are ultimately built.
Still, even with these caveats, the ratio of housing permits to household growth provides some indicator of where the supply shortfall is most severe. Indeed, new housing construction hasn’t kept pace with demand nationally. While this problem has been especially evident in the West, it affects markets across the country.