What Accounts for Recent Growth in Homeowner Households?
In 2017, the US added more homeowners than any year since at least 2005, when the American Community Survey (ACS) was first fully implemented.
However, the nation’s stock of newly built units grew only modestly last year. This begs the question: where did all the remaining owner-occupied units come from? In addition to new construction, ACS data suggests that homeowners were increasingly likely to occupy units that were previously rented, as well as some that were once vacant.
In total, the number of US households rose to 120.1 million last year, up 1.2 million from 2016. This is less than the growth in homeowners, which grew by 1.7 million households on net, an increase that was offset by a nearly 500,000 household net decrease in the number of renters (Figure 1). These household growth totals are in line with the Census’s quarterly Housing Vacancy Survey, which found that the number of homeowners rose by 1.6 million between the end of 2016 and the end of 2017.
Figure 1: The Large Number of New Homeowners Drove Household Growth in 2017
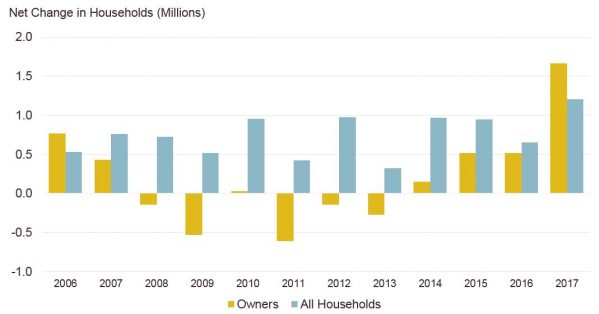
Source: JCHS tabulations of the US Census, American Community Survey 1-Year Estimates.
New residential construction could have accounted for only a share of the growth in new homeowner households. In 2017, 795,000 new single-family homes were completed, according to the Census Bureau, and approximately 95 percent of those units were built for owner-occupants. An additional 22,000 multifamily units were also built for sale.
A small share of the new homeowner households was previously vacant. According to the ACS, over the past year, the vacancy rate for owner-occupied units declined from 1.8 to 1.6 percent, a drop that could account for as many as 150,000 additional owner-occupied units. (Notably, this estimate doesn’t consider demolitions or other possible losses to the vacant stock that could cause the vacancy rate to fall.)
Even more importantly, our tabulations of ACS data also suggest that rental units are increasingly likely to be bought and occupied by homeowners, which is a notable reversal of patterns from recent years. For example, Stuart Rosenthal has estimated that between 2000 and 2014, more than 10 percent of homes built in the 1990s switched from owner- to renter-occupancy on net. Similarly, our latest State of the Nation’s Housing report found that 3.9 million single-family homes converted to the rental market in 2006–2016.
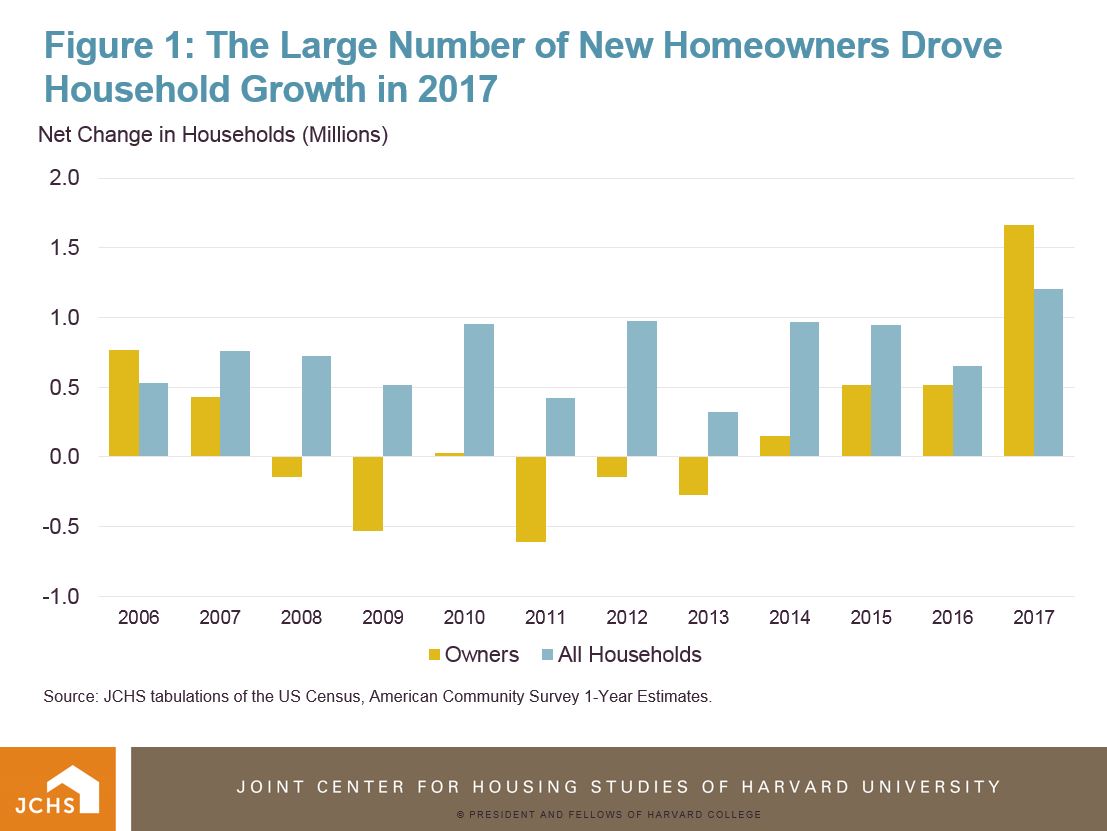
But in the last few years, recently built housing has been transitioning back to the owner-occupied stock, a trend that continued, even accelerated, in 2017. Notably, the total number of rental households dropped by 459,000 in 2017, and losses were particularly concentrated in unit types that are more likely to be owner-occupied. The number of single-family rentals, for example, declined 309,900 on net (2.1 percent of single-family rental households) while those in multifamily buildings declined 140,000 units (or 0.5 percent of the multifamily rental stock). This is significant because in 2017, homeownership rates in single-family homes were 82 percent and only 13 percent in multifamily buildings (Figure 2).
Figure 2: After Growing by 3.9 Million Units Since 2005, Single-Family Rentals Comprised the Bulk of Losses to the rental Stock Last Year
Source: JCHS tabulations of the US Census, American Community Survey 1-Year Estimates.
Of course, single-family rentals might be more likely to leave the stock for other reasons. For example, these units tend to be older and, therefore, more likely to be demolished. Illustratively, 62 percent of single-family rentals were built before 1980 compared with only 54 percent of multifamily rentals.
However, the loss of single-family rental units was especially concentrated among newer homes, which are the units least likely to be demolished. The Joint Center’s analysis of ACS data, for example, indicates that among the net losses to single-family rentals, about 132,800 units (or 41 percent of the total net losses to the rental stock) were built between 2000 and 2009. In contrast, 47,600 single-family rentals built between 1980 and 1999 were also lost in some fashion, as were 97,100 units built between 1960 and 1979 and 103,700 units built before 1960.
Sampling error and upward corrections to housing unit counts in 2017 are another possible—and potentially more problematic—source of the reported growth in owner-occupied units. But homeownership rates, which should be less influenced by year-to-year changes in the stock count, provide additional evidence that conversions to homeownership accelerated in 2017. Specifically, any over-counting of homeowners would need to apply differently to renters, or change systematically over time, to bias the homeownership rates for different vintages of the housing stock.
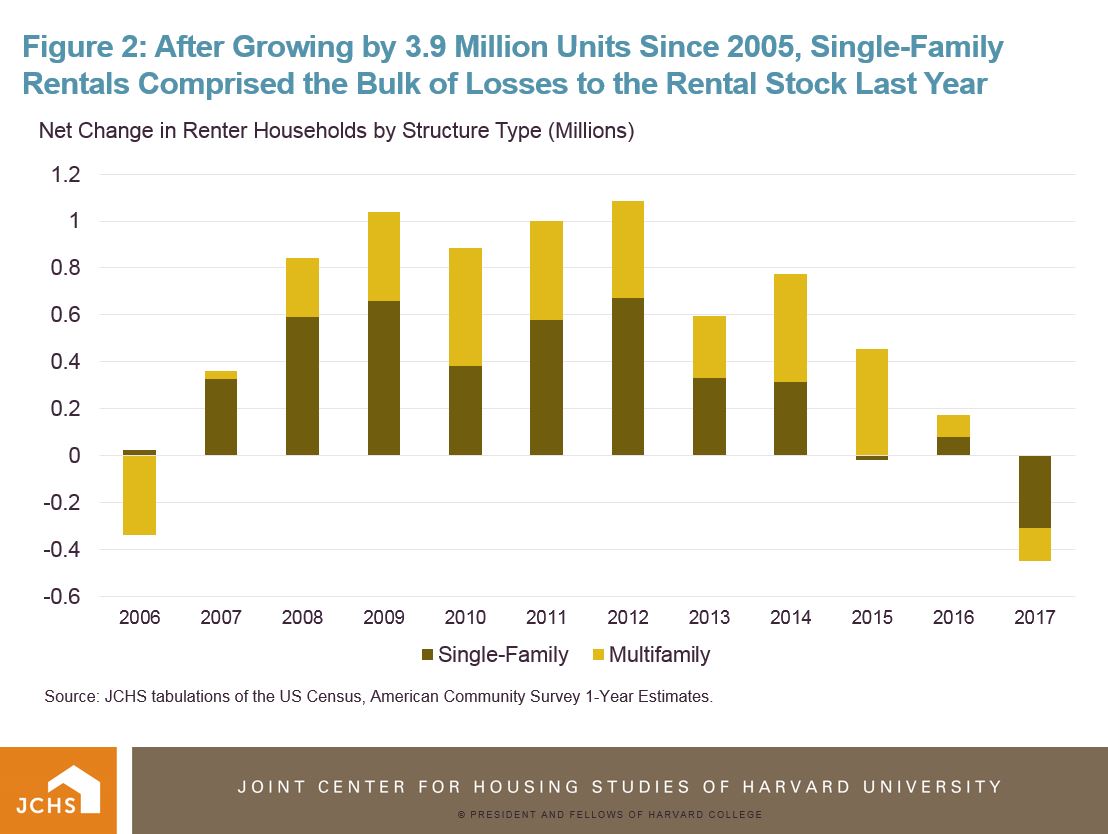
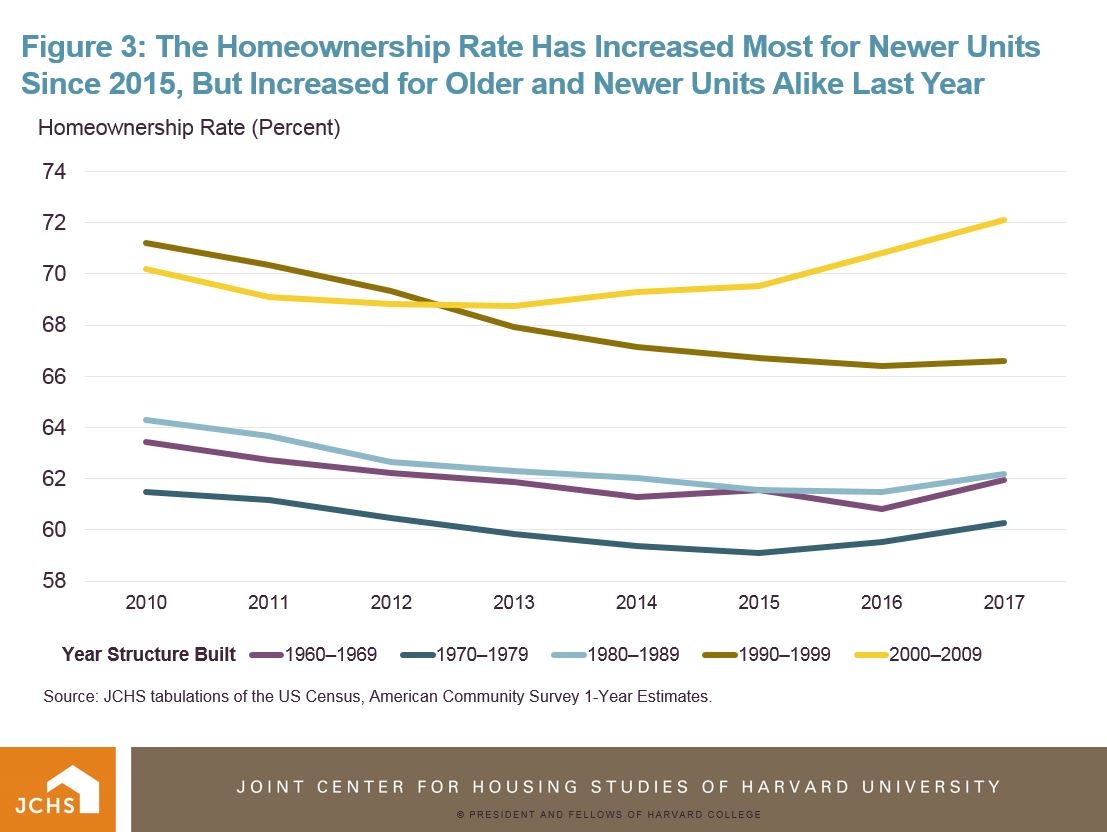
Consistent with Rosenthal’s findings, the homeownership rate for all homes, regardless of their age, declined between 2010 and 2013. However, starting in 2014, the homeownership rate increased modestly only for units built between 2000 and 2009, increasing even more sharply for those units built in 2016 and 2017. In contrast, homeownership rates for units built before 2000 fell in 2014, had mixed results in 2015 and 2016, and increased modestly for all older homes in 2017 (Figure 3).
Figure 3: The Homeownership Rate Has Increased Most for Newer Units Since 2015, But Increased for Older and Newer Units Alike Last Year
Source: JCHS tabulations of the US Census, American Community Survey 1-Year Estimates.
These changes in tenure are especially noteworthy because they seem inconsistent with conventional views of long-run trends in housing at first glance. Housing quality inevitably declines as the housing stock ages and that decline in quality generally causes units to filter from owner- to renter-occupancy. This helps explain why homeownership rates are higher for households in newer units than those in older units.
But, as Rosenthal has discussed, tenure switches involve both short- and long-term conversions. And in the short run, the “normal” filtering process can reverse (or accelerate) to accommodate fluctuating market conditions. Data in the 2017 ACS provides strong evidence that while new construction met a significant share of the demand for homeownership opportunities, tenure conversions, particularly among new units, also helped fill the gaps created by historically low levels of new construction.


