The Most Popular Remodeling Projects: Rich Data Tables Provide Insights and Answer Key Questions
What are the most common types of home improvement projects? How much do homeowners spend on a typical bathroom remodel if installed by professional contractors versus as a do-it-yourself project? What share of the national home improvement market do owners age 65 and over comprise? How does average spending vary at different levels of household income or home value? How have all of these trends changed over time? Answers to these questions and others can be found in the extensive data tables released with the latest Improving America’s Housing report from our Remodeling Futures Program.
The report’s data tables include biennial information on US home improvement and repair spending for 1995–2017 by project type, installation type (professional or DIY), homeowner demographic and socioeconomic characteristics (age, race/ethnicity, income, family composition, etc.), housing stock characteristics (value, year built, structure type, location, etc.), and more. All data tables include the number of homeowners reporting improvement or repair projects, average project spending levels, and total expenditures nationally. These tabulations are produced using American Housing Survey (AHS) data from the US Department of Housing and Urban Development, and the data tables are available for download in Excel format for easy custom analysis.
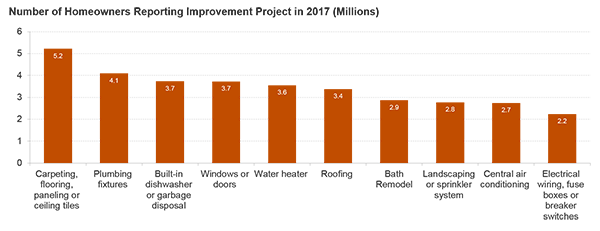
From Table A-1 we see that the most common project in 2017 was adding or replacing carpeting or flooring, with 5.2 million homeowners, or 7 percent, making this improvement to their home. Other common projects included adding or replacing plumbing fixtures (like sinks and bathtubs), windows or doors, built-in dishwashers or garbage disposals, and water heaters, with 5 percent of owners making each of these types of improvements. In fact, nearly 1 in 4 homeowners had some type of replacement project in 2017 to update home components or systems, compared to 9 percent of owners making improvements to their lot or yard (such as driveways or walkways, fencing or walls, sheds, landscaping, etc.) and 8 percent making discretionary improvements (including kitchen and bathroom remodeling, room additions, and porches or decks).
Figure 1: Top 10 Most Common Home Improvement Projects Include Many Replacements to Home Components and Systems
Source: Improving America’s Housing 2019, Appendix Data Tables, Table A-1.
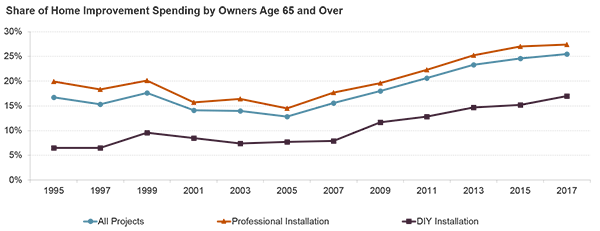
Tables A-5 and A-6 can be used to compare home improvement projects by installation type, and here the data show that in 2017 average spending for a DIY bathroom remodel was $3,100, or about one-third the amount of spending for a typical professional bath remodel at $9,400. This ratio is fairly consistent across time and across the various project types. Table A-7 provides improvement expenditures by homeowner and housing stock characteristics and answers the question about market activity by age of owners. Strikingly, in 2017, more than a quarter of home improvement expenditure nationally was by homeowners age 65 and over compared to about 15 percent between 1995 and 2005. However, using information on installation type from Tables A-8 and A-9, we see that older owners made up only 17 percent of all DIY spending in 2017, compared to more than 27 percent of professional project expenditure. This indicates that older homeowners are still much less likely than younger owners to do projects themselves, even though their share of the DIY market has expanded significantly over the past decade.
Figure 2: Older Owners Have Greatly Expanded Their Remodeling Market Share, But Remain a Smaller Share of the DIY Market
Source: Improving America’s Housing 2019, Appendix Data Tables, Tables A-7, A-8, and A-9.
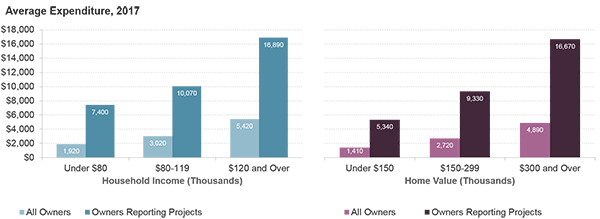
Information on average home improvement spending levels by household income and home value categories in Table A-7 suggests these factors are important drivers of remodeling activity. With higher incomes and home values, homeowners tend to spend significantly more on home improvements. Middle income homeowners spent about 60 percent more on average for remodeling in 2017 than lower-income owners, and higher-income owners spent fully 80 percent more than the typical middle-income homeowner. Similarly, owners with home values between $150,000 and $299,999 spent twice as much on average for improvements in 2017 than owners with homes valued under $150,000, while owners in homes valued at $300,000 or more also averaged 80 percent higher spending than owners in mid-value homes. In 2007, at the peak of the last boom in remodeling, these differences were even greater, with higher-income owners outspending middle-income owners by double on average, and owners of higher-value homes spending 140 percent more on average than owners of mid-value homes.
Figure 3: Owners with Higher Incomes and Home Values Tend to Spend More for Home Improvements


