Six Takeaways from America’s Rental Housing 2026

Our latest report America’s Rental Housing 2026, out today (livestream at 4pm ET), highlights rental market trends and the immense affordability challenges that renters face. At the end of last year, rental demand slowed and rents fell modestly. Despite this recent dip, the high cost of construction and the increasing presence of higher-income households in the rental market have contributed to a longer-term upward shift in rents. Housing cost burdens remain a widespread concern. In response, a growing number of places are implementing policies to expand the rental supply and improve affordability.
1. Rental Demand Has Slowed
The high cost of homeownership supported strong renter household growth going into last year, contributing to a record-high annual increase of 784,000 apartment households in the second quarter of 2025 (Figure 1). The weak job market, economic uncertainty, and restricted immigration slowed demand considerably as the year went on. In the fourth quarter of 2025, the growth in apartment households fell to 366,000.
Figure 1: Additions to Apartment Demand and Supply Have Slowed
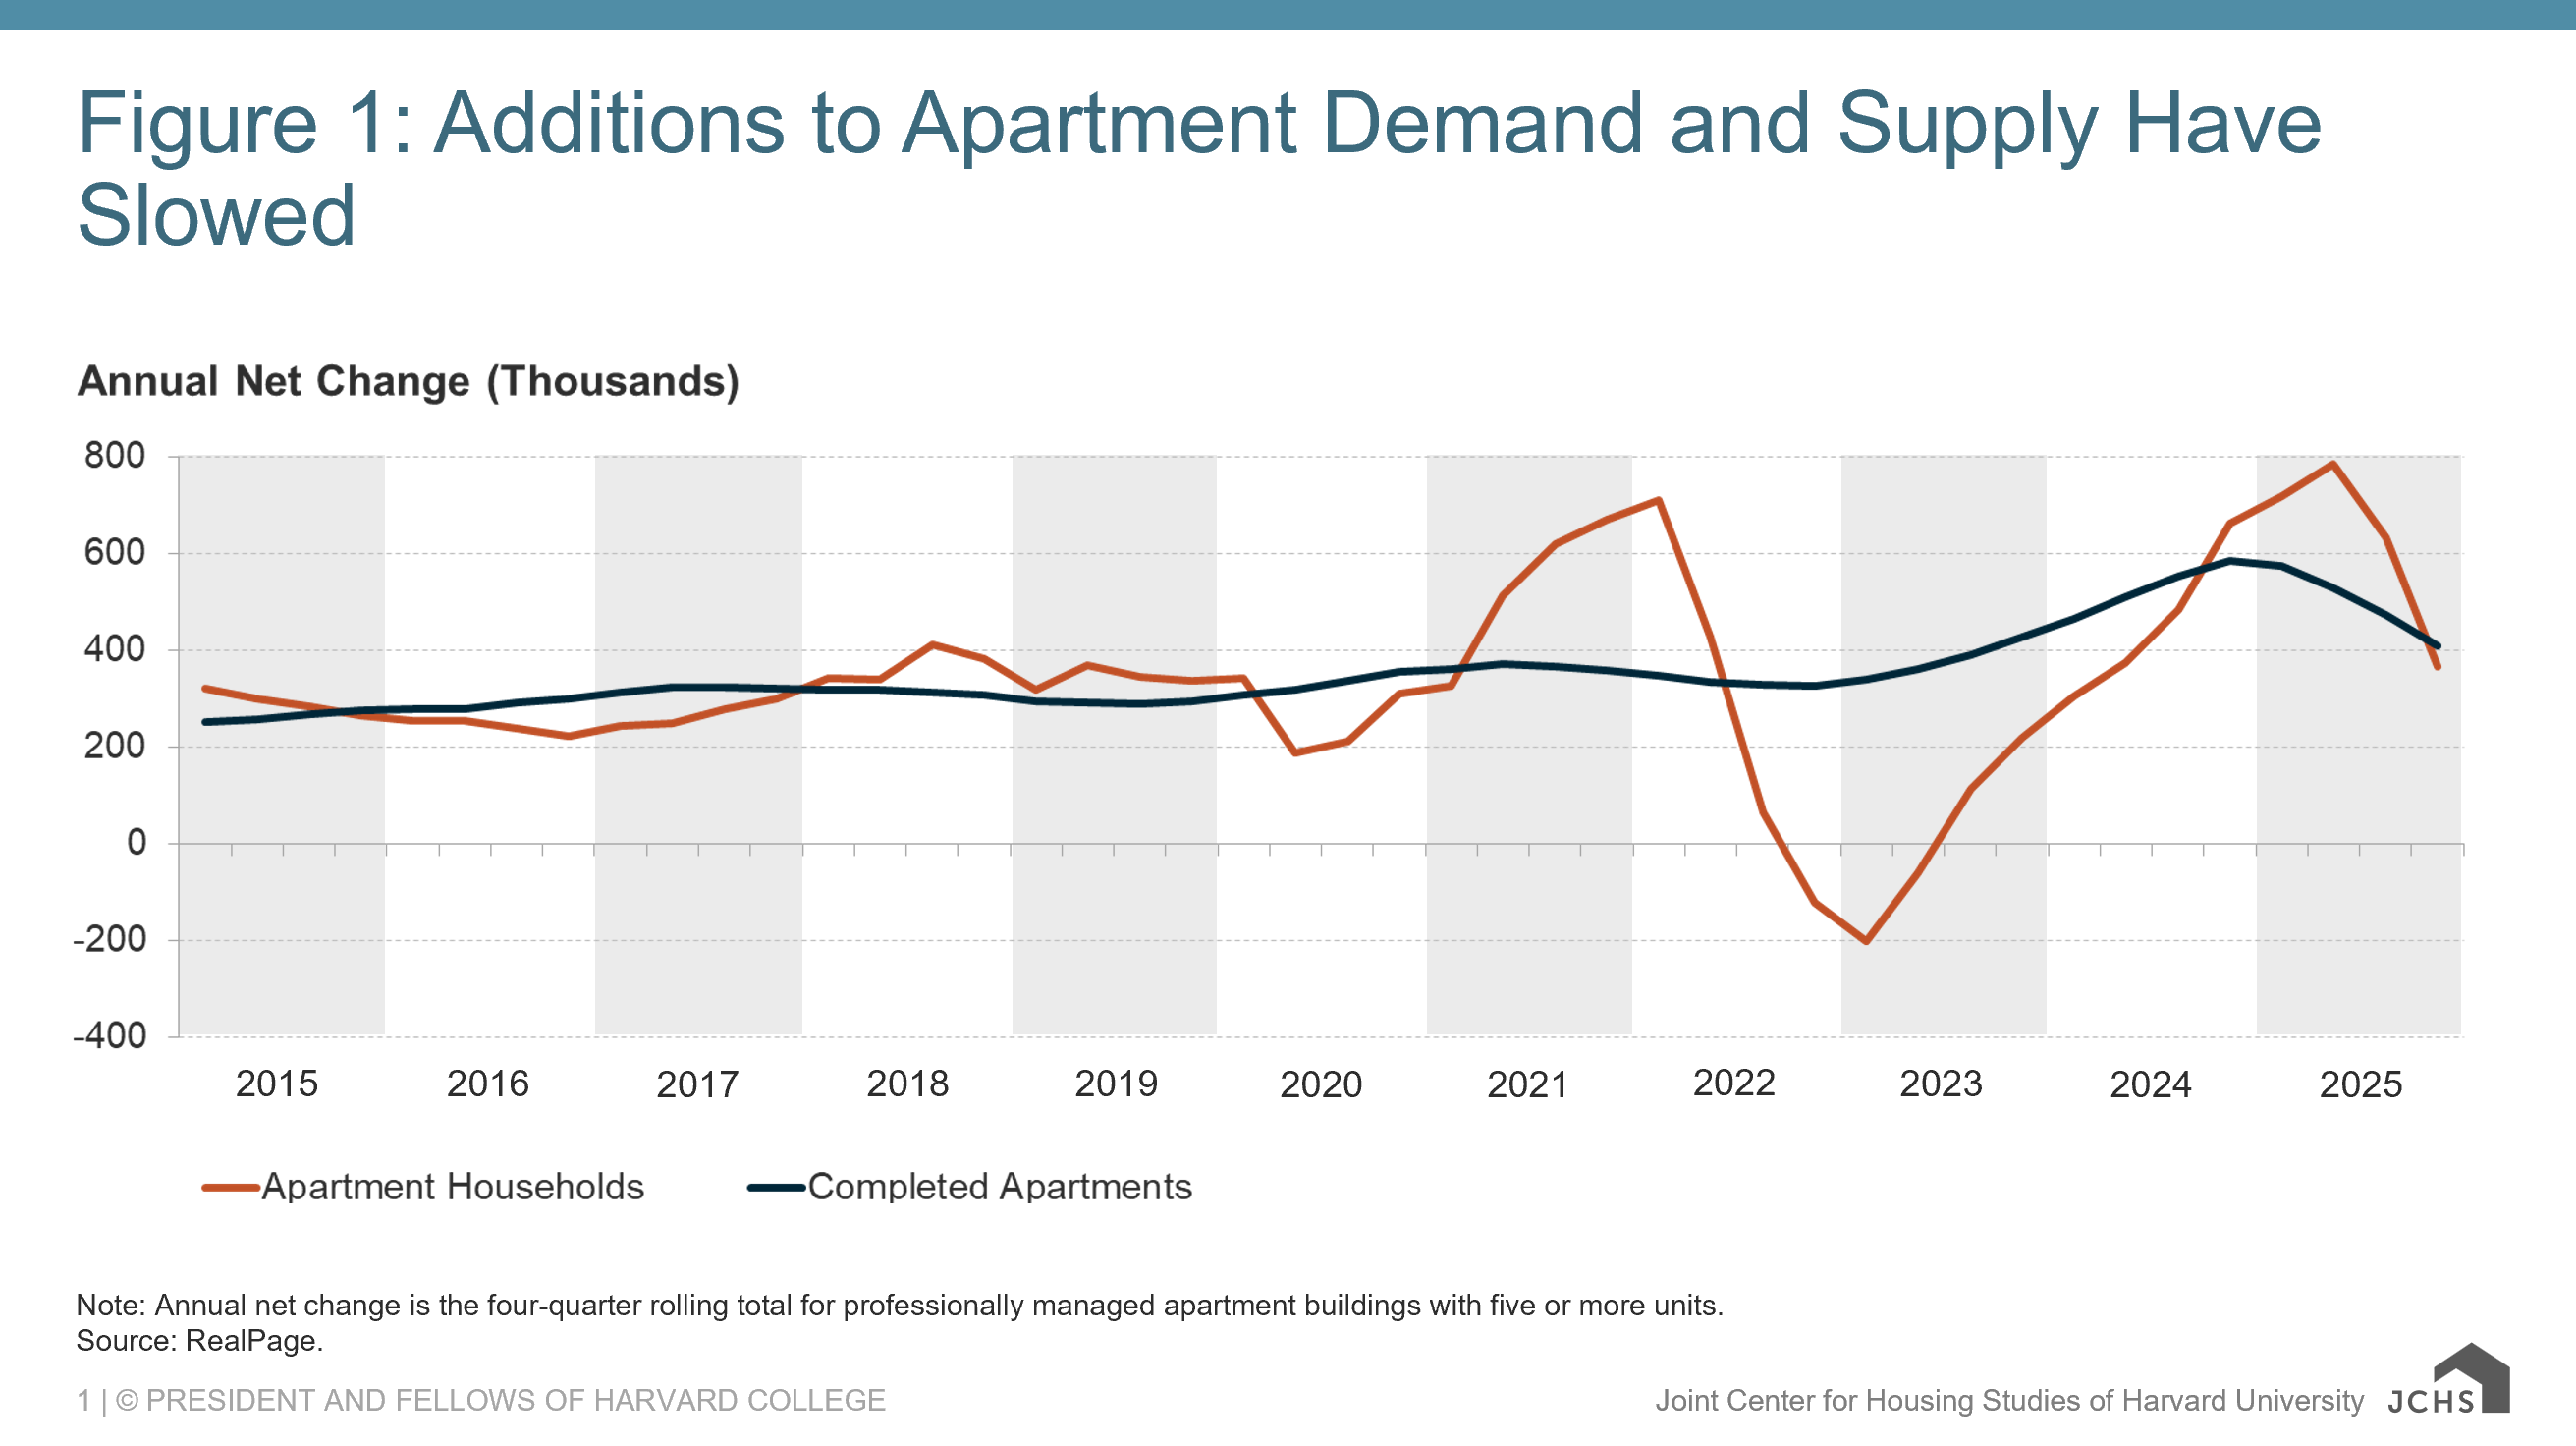
Note: Annual net change is the four-quarter rolling total for professionally managed apartment buildings with five or more units.
Source: RealPage.
Over the last decade, most new rental demand has come from higher-income households. After a brief dip from 2019 to 2021 when households bought homes at greater rates, the number of renter households making $75,000 or more in inflation-adjusted terms rose by 1.7 million from 2021 to 2024 (Interactive).
2. The Rental Market Has Softened
An influx of new apartments and a slowdown in demand have pushed vacancy rates up and rents down. After record-high increases during the pandemic, growth in asking rents has hovered near zero since mid-2023. In the fourth quarter of 2025, rents for professionally managed apartments fell slightly, by 0.6 percent year over year. Declining rents in the South and the West—regions where new supply has been heavily concentrated—drove this trend (Figure 2).
Figure 2: Rent Growth Has Come to a Standstill
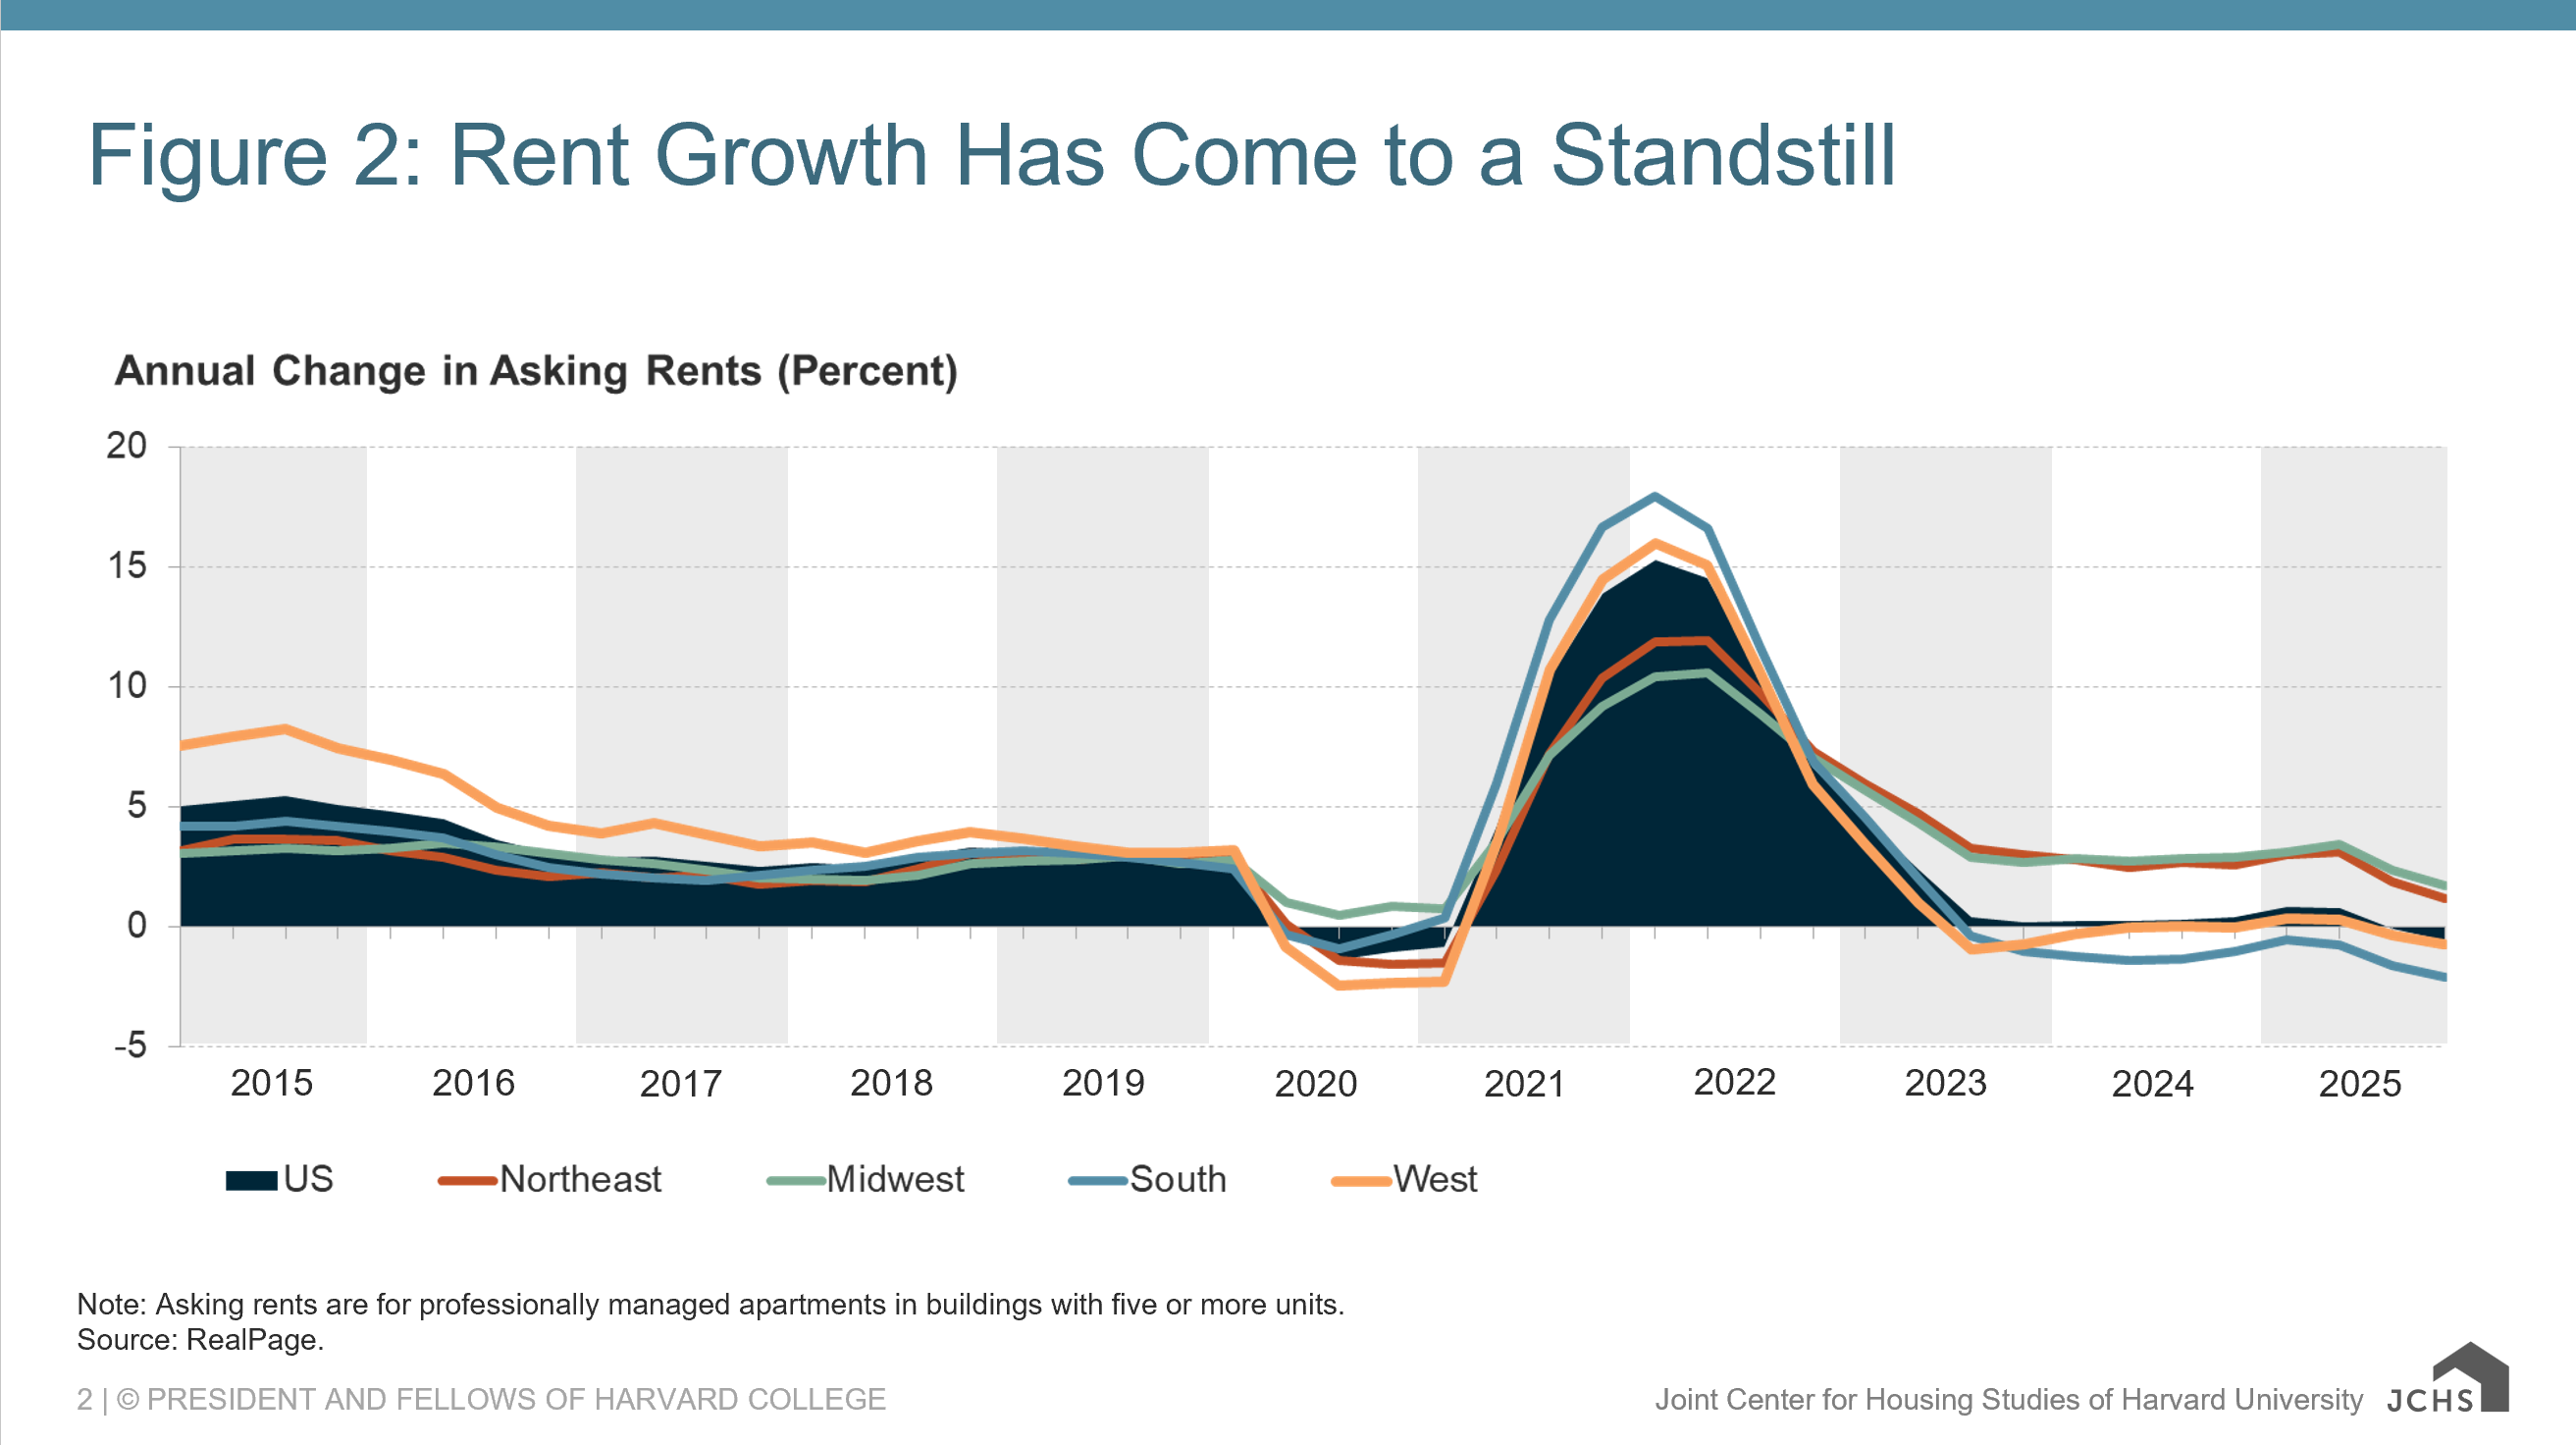
Note: Asking rents are for professionally managed apartments in buildings with five or more units.
Source: RealPage.
3. Multifamily Construction Is Cooling
Rising costs and weak rent growth have made new construction more difficult. Despite signs of cooling construction, the multifamily pipeline is still relatively strong (Figure 3). In 2025, 416,000 multifamily units were started, well below the recent peak in 2022 but above the pre-pandemic average. The number of units under construction similarly remains high despite falling rapidly to 686,000 in 2025 from a record high of 996,000 in 2023.
Figure 3: The Heated Pace of Multifamily Construction Has Cooled
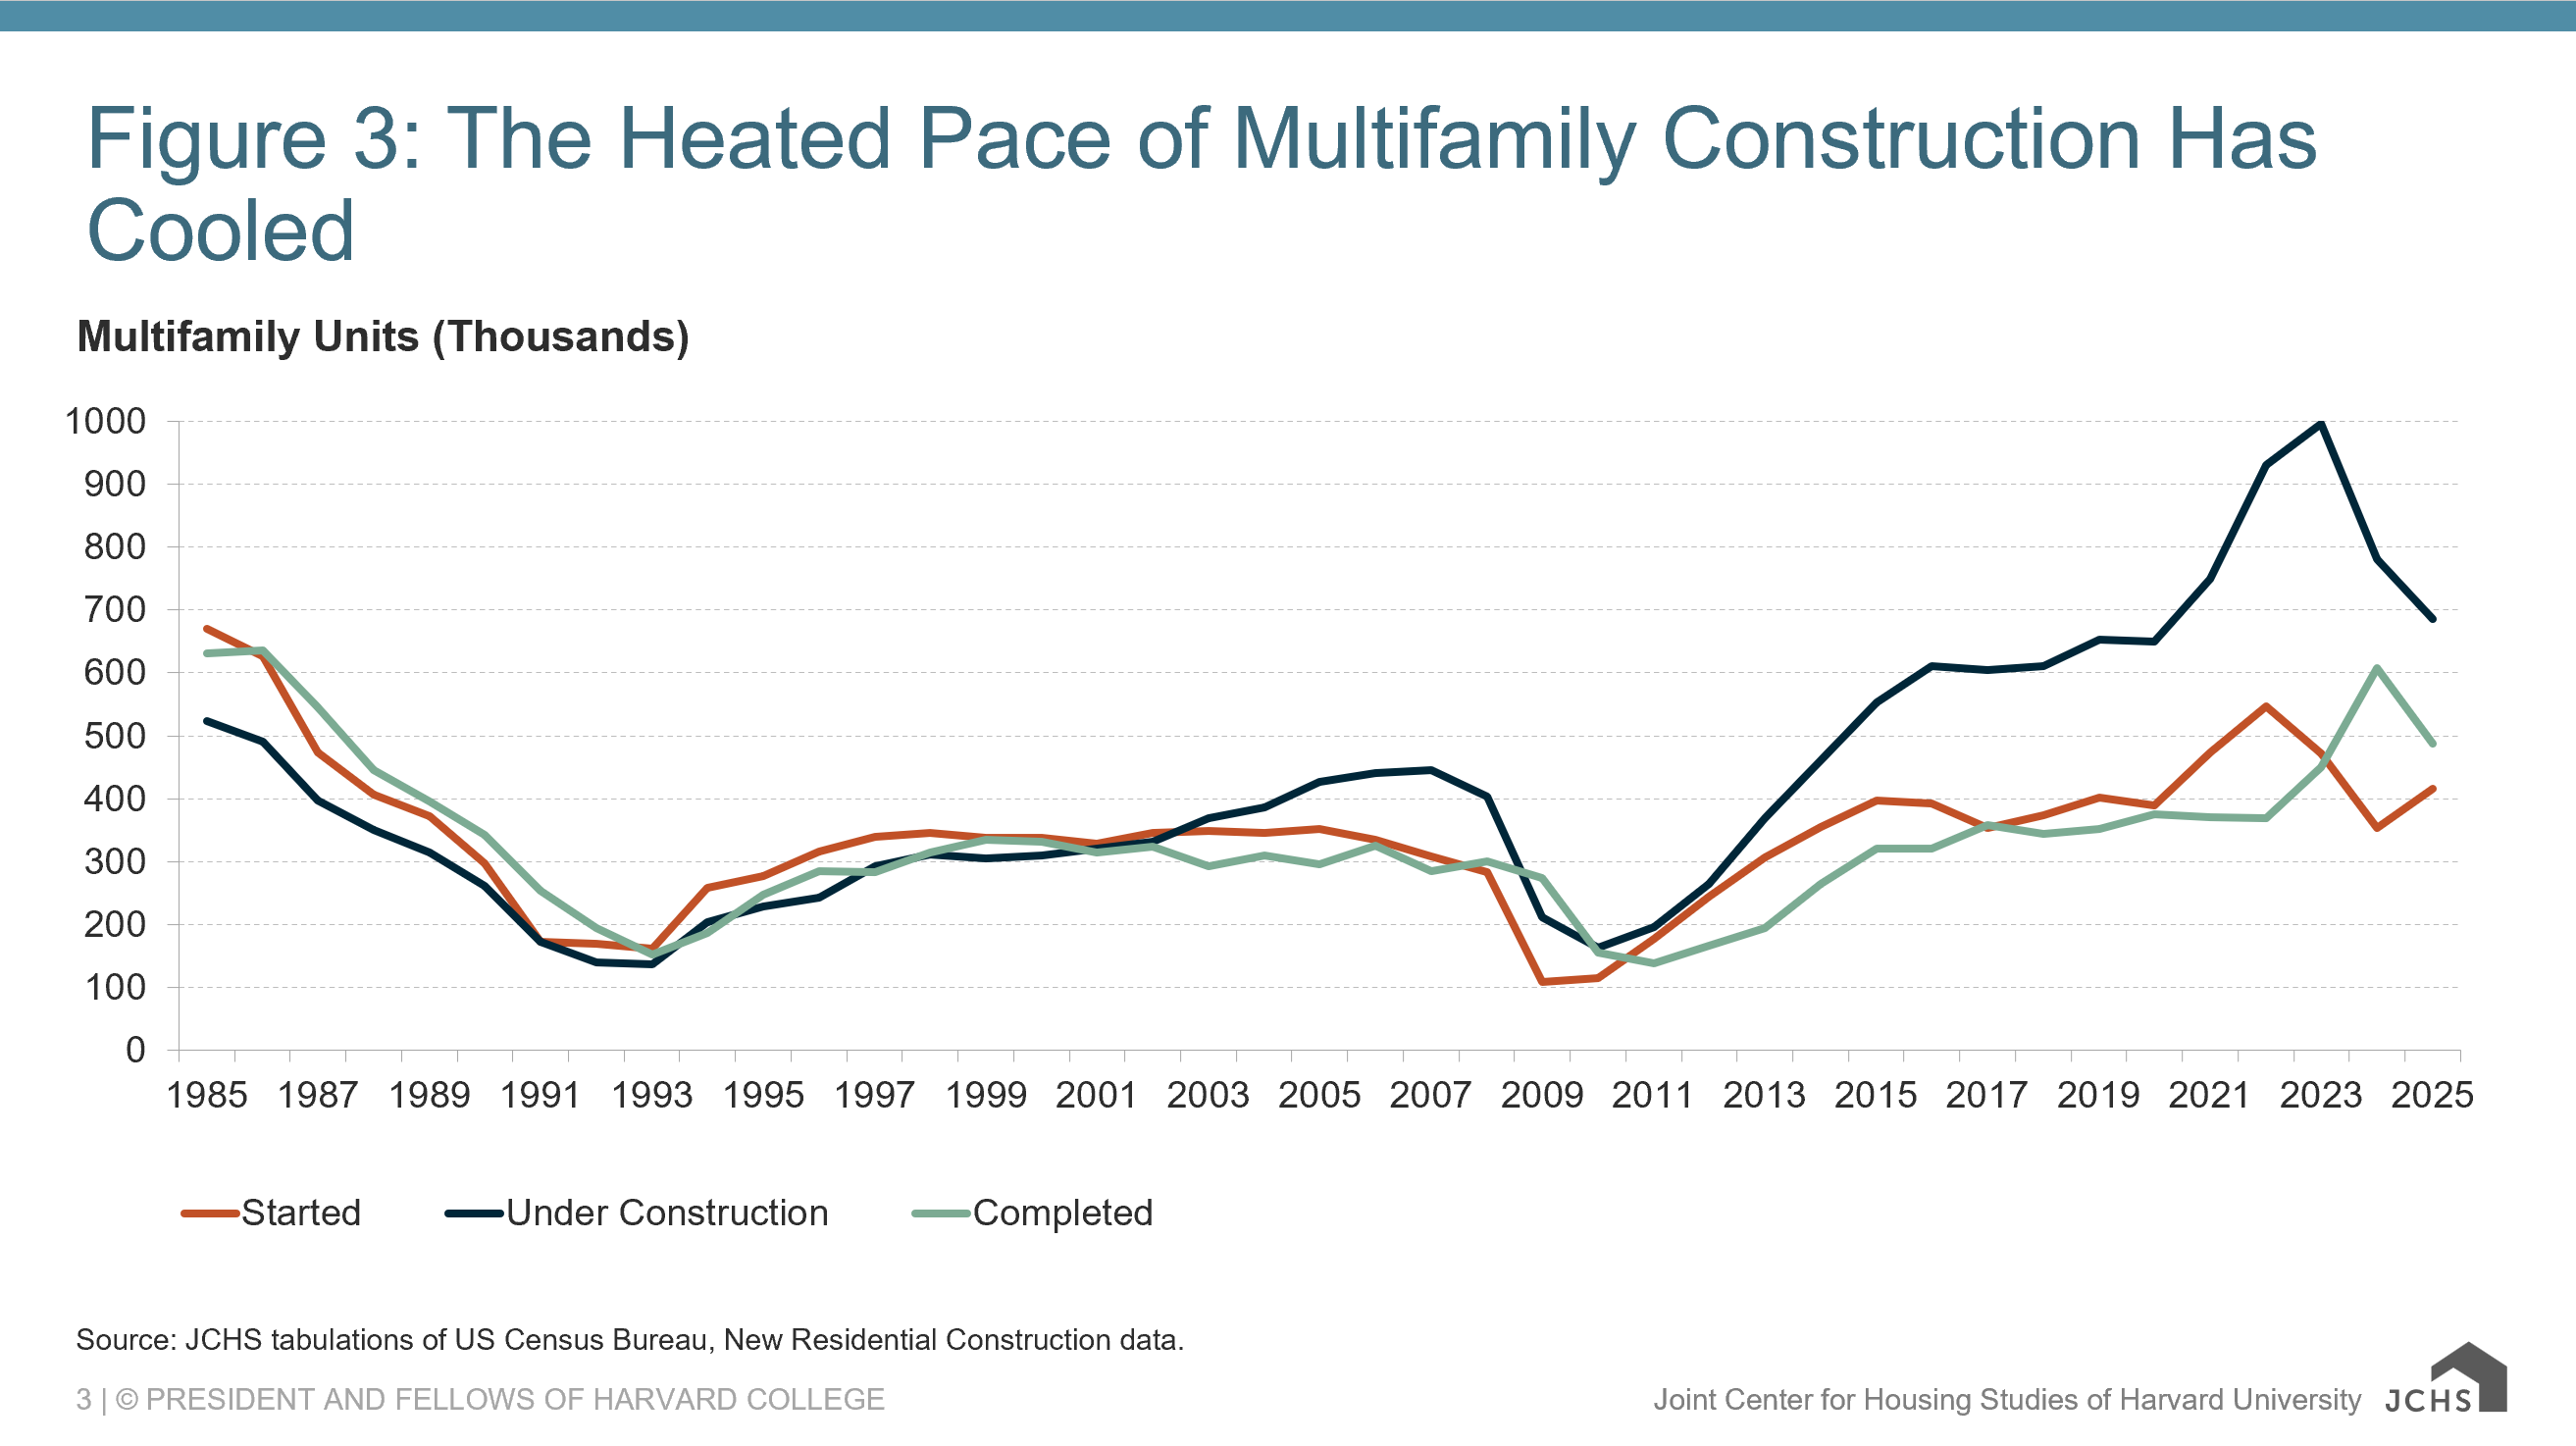
Source: JCHS tabulations of US Census Bureau, New Residential Construction data.
This robust pipeline has kept completions high. In 2024, 608,000 multifamily units were completed, the highest volume since 1986. Even after a 20 percent drop, 488,000 units were added to the market in 2025.
4. The Rent Distribution Has Shifted Upwards
The rising cost of building and operating apartments since the pandemic has contributed to the longer-term upward shift in the rent distribution. The number of units renting for at least $1,400 grew by 11.8 million units from 2014 to 2024, including an additional 5.8 million renting for $2,000 or more (Interactive). At the same time, the number of units renting for less than $1,400 declined by 9.3 million, including a drop of 2.5 million units renting for less than $600.
5. Affordability Remains a Significant Challenge
The number of cost-burdened renter households hit yet another record high in 2024 (Figure 4) at 22.7 million (49 percent). While cooling rent growth made this a relatively modest annual increase of 170,000 households, there were still 2.3 million more cost-burdened households than in 2019 and 7.9 million more than in 2001. Additionally, 12.1 million renters (26 percent) spend more than half of income on rent and utilities, making them severely burdened.
Figure 4: The Number of Cost-Burdened Renters Has Hit Another All-Time High
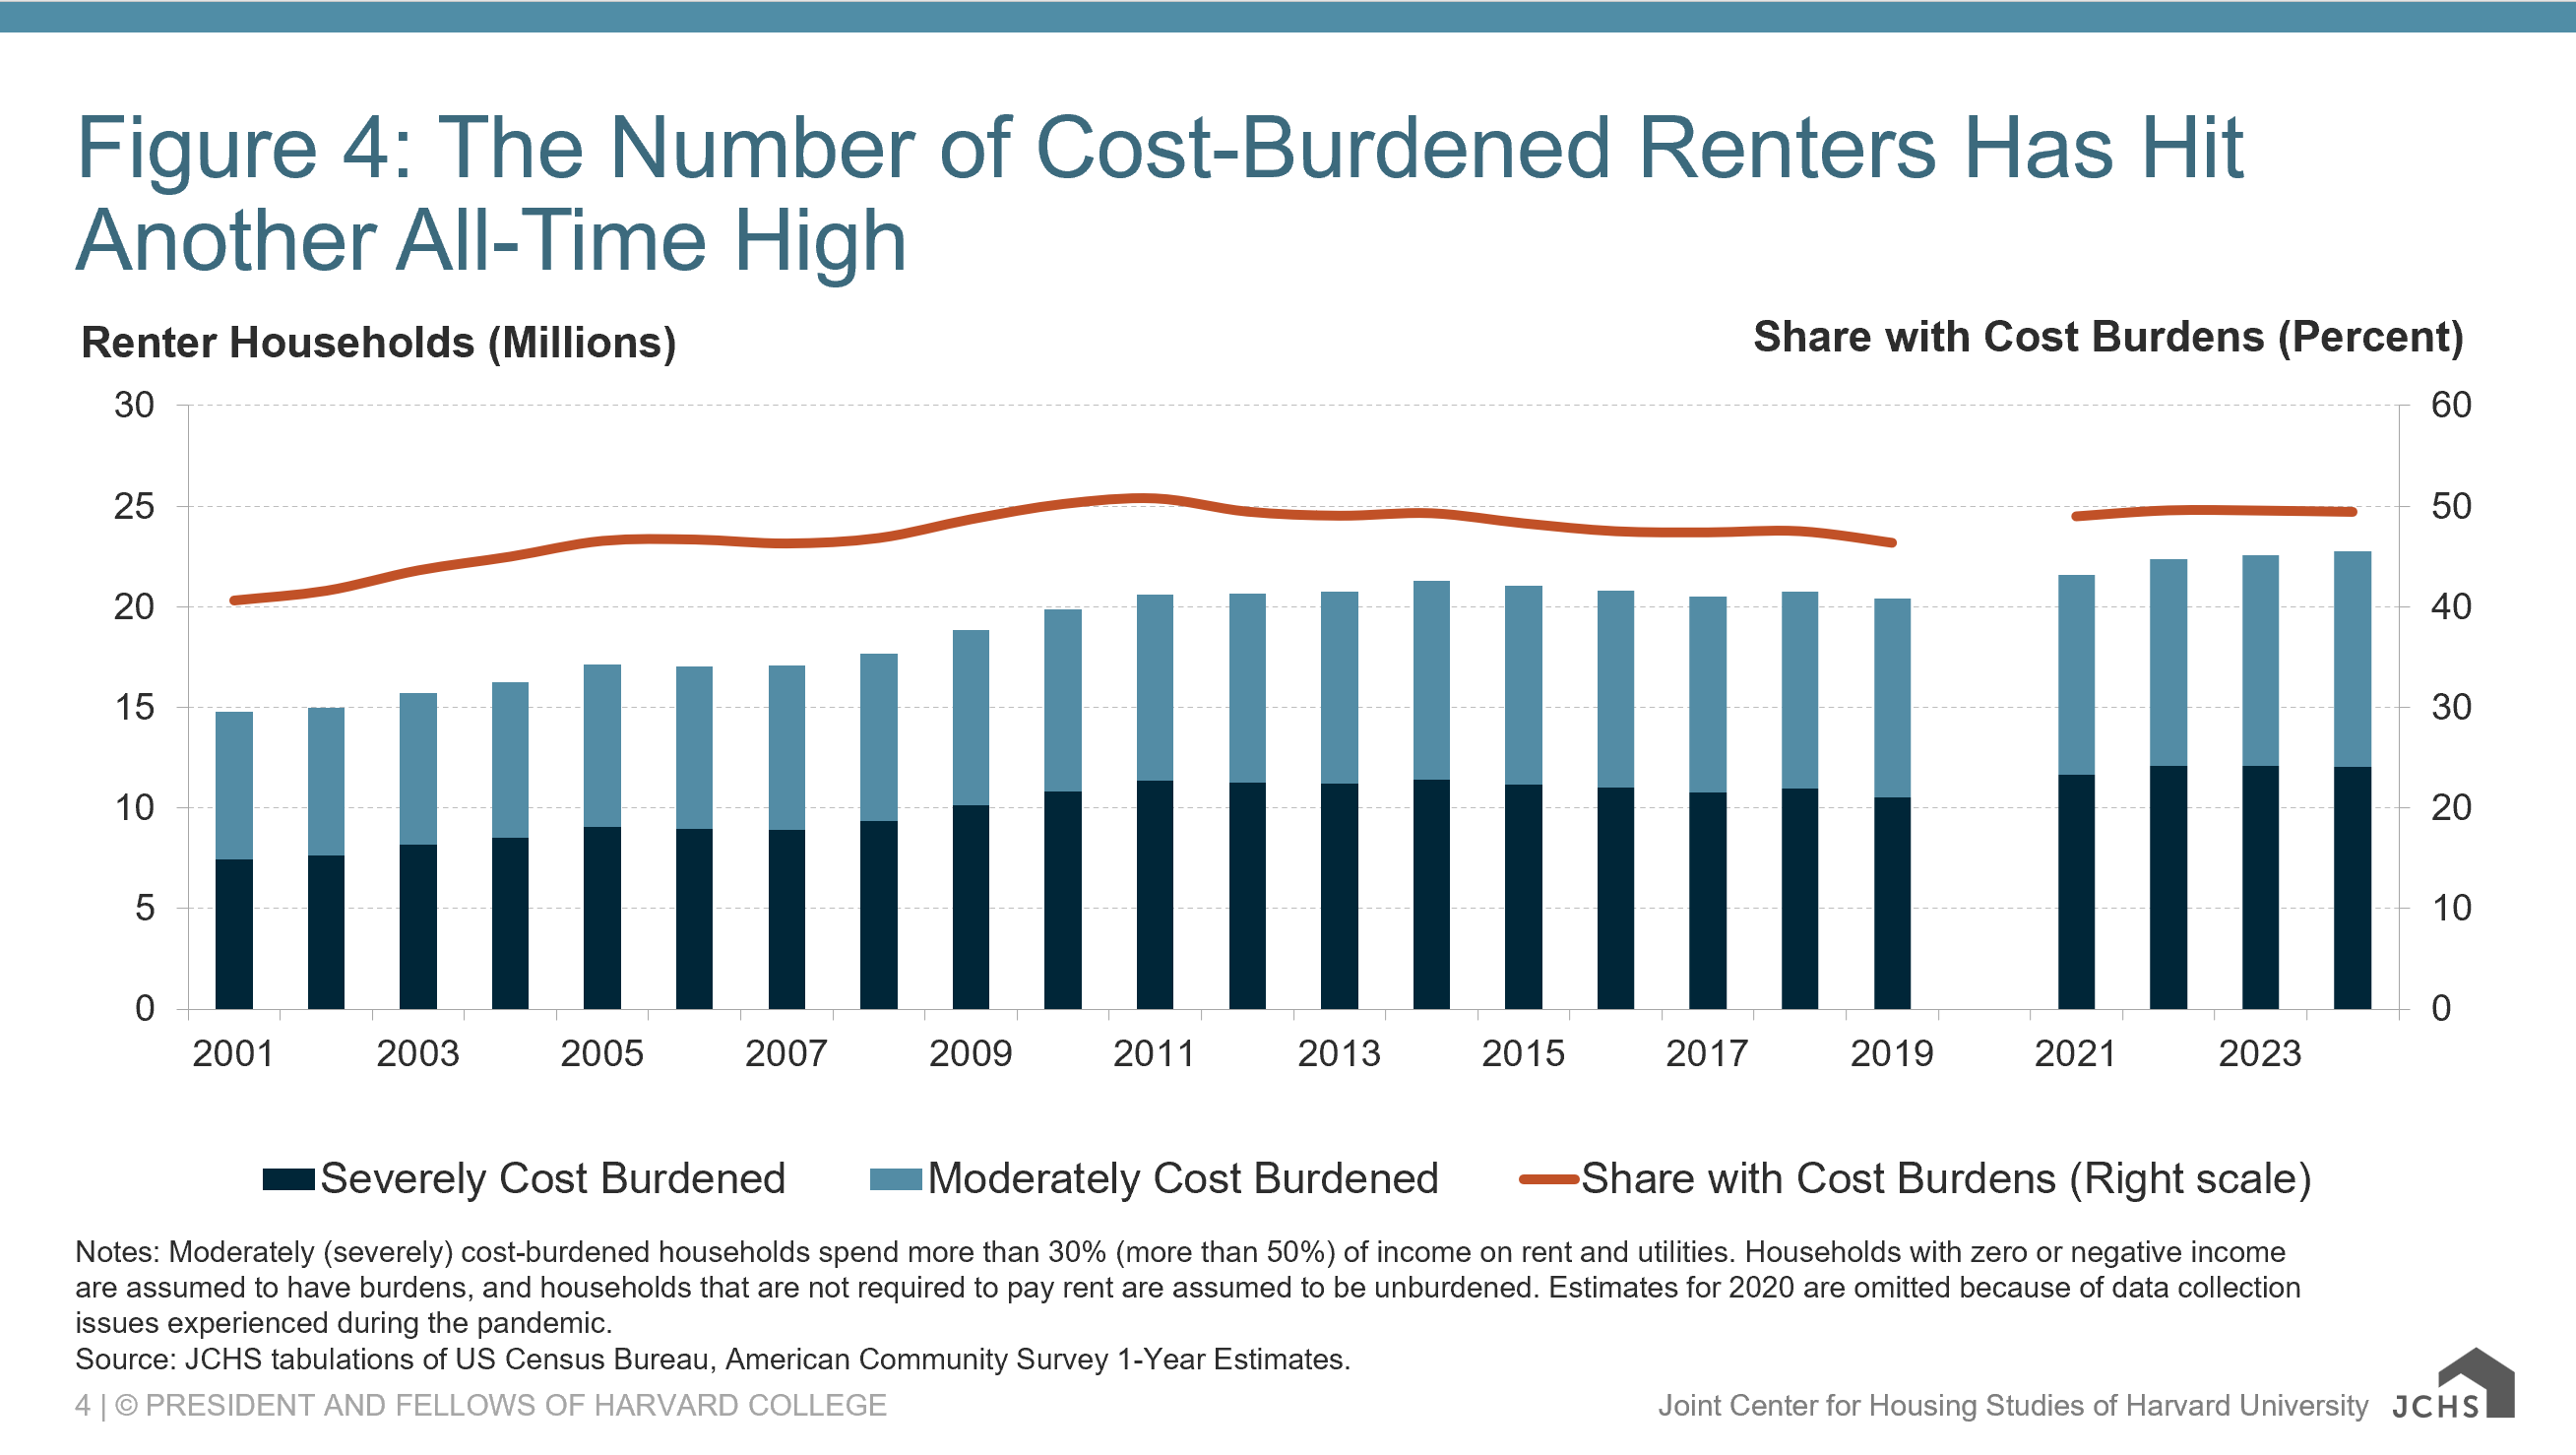
Notes: Moderately (severely) cost-burdened households spend more than 30% (more than 50%) of income on rent and utilities. Households with zero or negative income are assumed to have burdens, and households that are not required to pay rent are assumed to be unburdened. Estimates for 2020 are omitted because of data collection issues experienced during the pandemic.
Source: JCHS tabulations of US Census Bureau, American Community Survey 1-Year Estimates.
Rising rents consume an increasing share of household incomes. From 2001 to 2024, renter incomes rose by 9 percent in real terms while rents rose by 30 percent. As a result, the residual income that households have left over after paying rent has declined, especially for lower-income renters. Since 2001, lower-income households’ residual income has fallen by 60 percent to a record low of $210, even as the cost of food and healthcare is rising. This forces difficult tradeoffs that the social safety net helps alleviate, but recent cuts to SNAP and Medicaid will make it even harder for lower-income renters to manage growing costs.
6. Policy Solutions Are Gaining Momentum
Widespread unaffordability has encouraged bipartisan support for policy solutions. At the federal level, the 2025 reconciliation bill permanently increased allocations for the competitive Low-Income Housing Tax Credit by 12 percent. Appropriations for fiscal year 2026 increased the HUD budget, bucking proposals for large-scale cuts to rental assistance programs. Additionally, the Senate passed the ROAD to Housing Act out of committee while the House passed the Housing for the 21st Century Act, which include provisions to increase supply, expand support for home repair and disaster recovery, and reduce administrative burdens.
Even so, federal resources fall far short of need, and state and local governments are working to fill the gaps, including leveraging funding sources for rental assistance programs and passing sweeping zoning reforms. Local governments are also increasingly embracing mixed-income and social housing models, with Seattle, Chicago, and Montgomery County, Maryland, among the places mounting innovative programs. Nonetheless, growing holes in the social safety net underscore the need for policies that help renters reduce housing costs. These efforts are a bright spot at a time of deep and widespread unaffordability.


