Renters’ Affordability Challenges Worsened Last Year

The number of cost-burdened renter households hit yet another record high last year, according to the most recent data from the American Community Survey. In a new research brief, my co-authors and I update the data in our America’s Rental Housing 2024 report to highlight the current affordability challenges US renters face. We find that affordability has worsened across several dimensions, affecting more households up and down the income scale and leaving the lowest-income households with less left over than ever before.
In 2023, the number of renter households spending more than 30 percent of their incomes on rent and utilities hit an all-time high of 22.6 million (Figure 1). This included a record-high 12.1 million severely burdened households that spent more than half of their incomes on housing costs. The most recent count marks an increase of 209,000 households in the last year, 2.2 million since 2019, and 7.8 million since 2001. With this rise, half of all renter households were cost burdened in 2023. While this rate was essentially unchanged compared to the year before, it rose 3.2 percentage points from pre-pandemic levels and 9.0 percentage points since 2001.
Figure 1: The Number of Cost-Burdened Renters Has Hit Another Record High
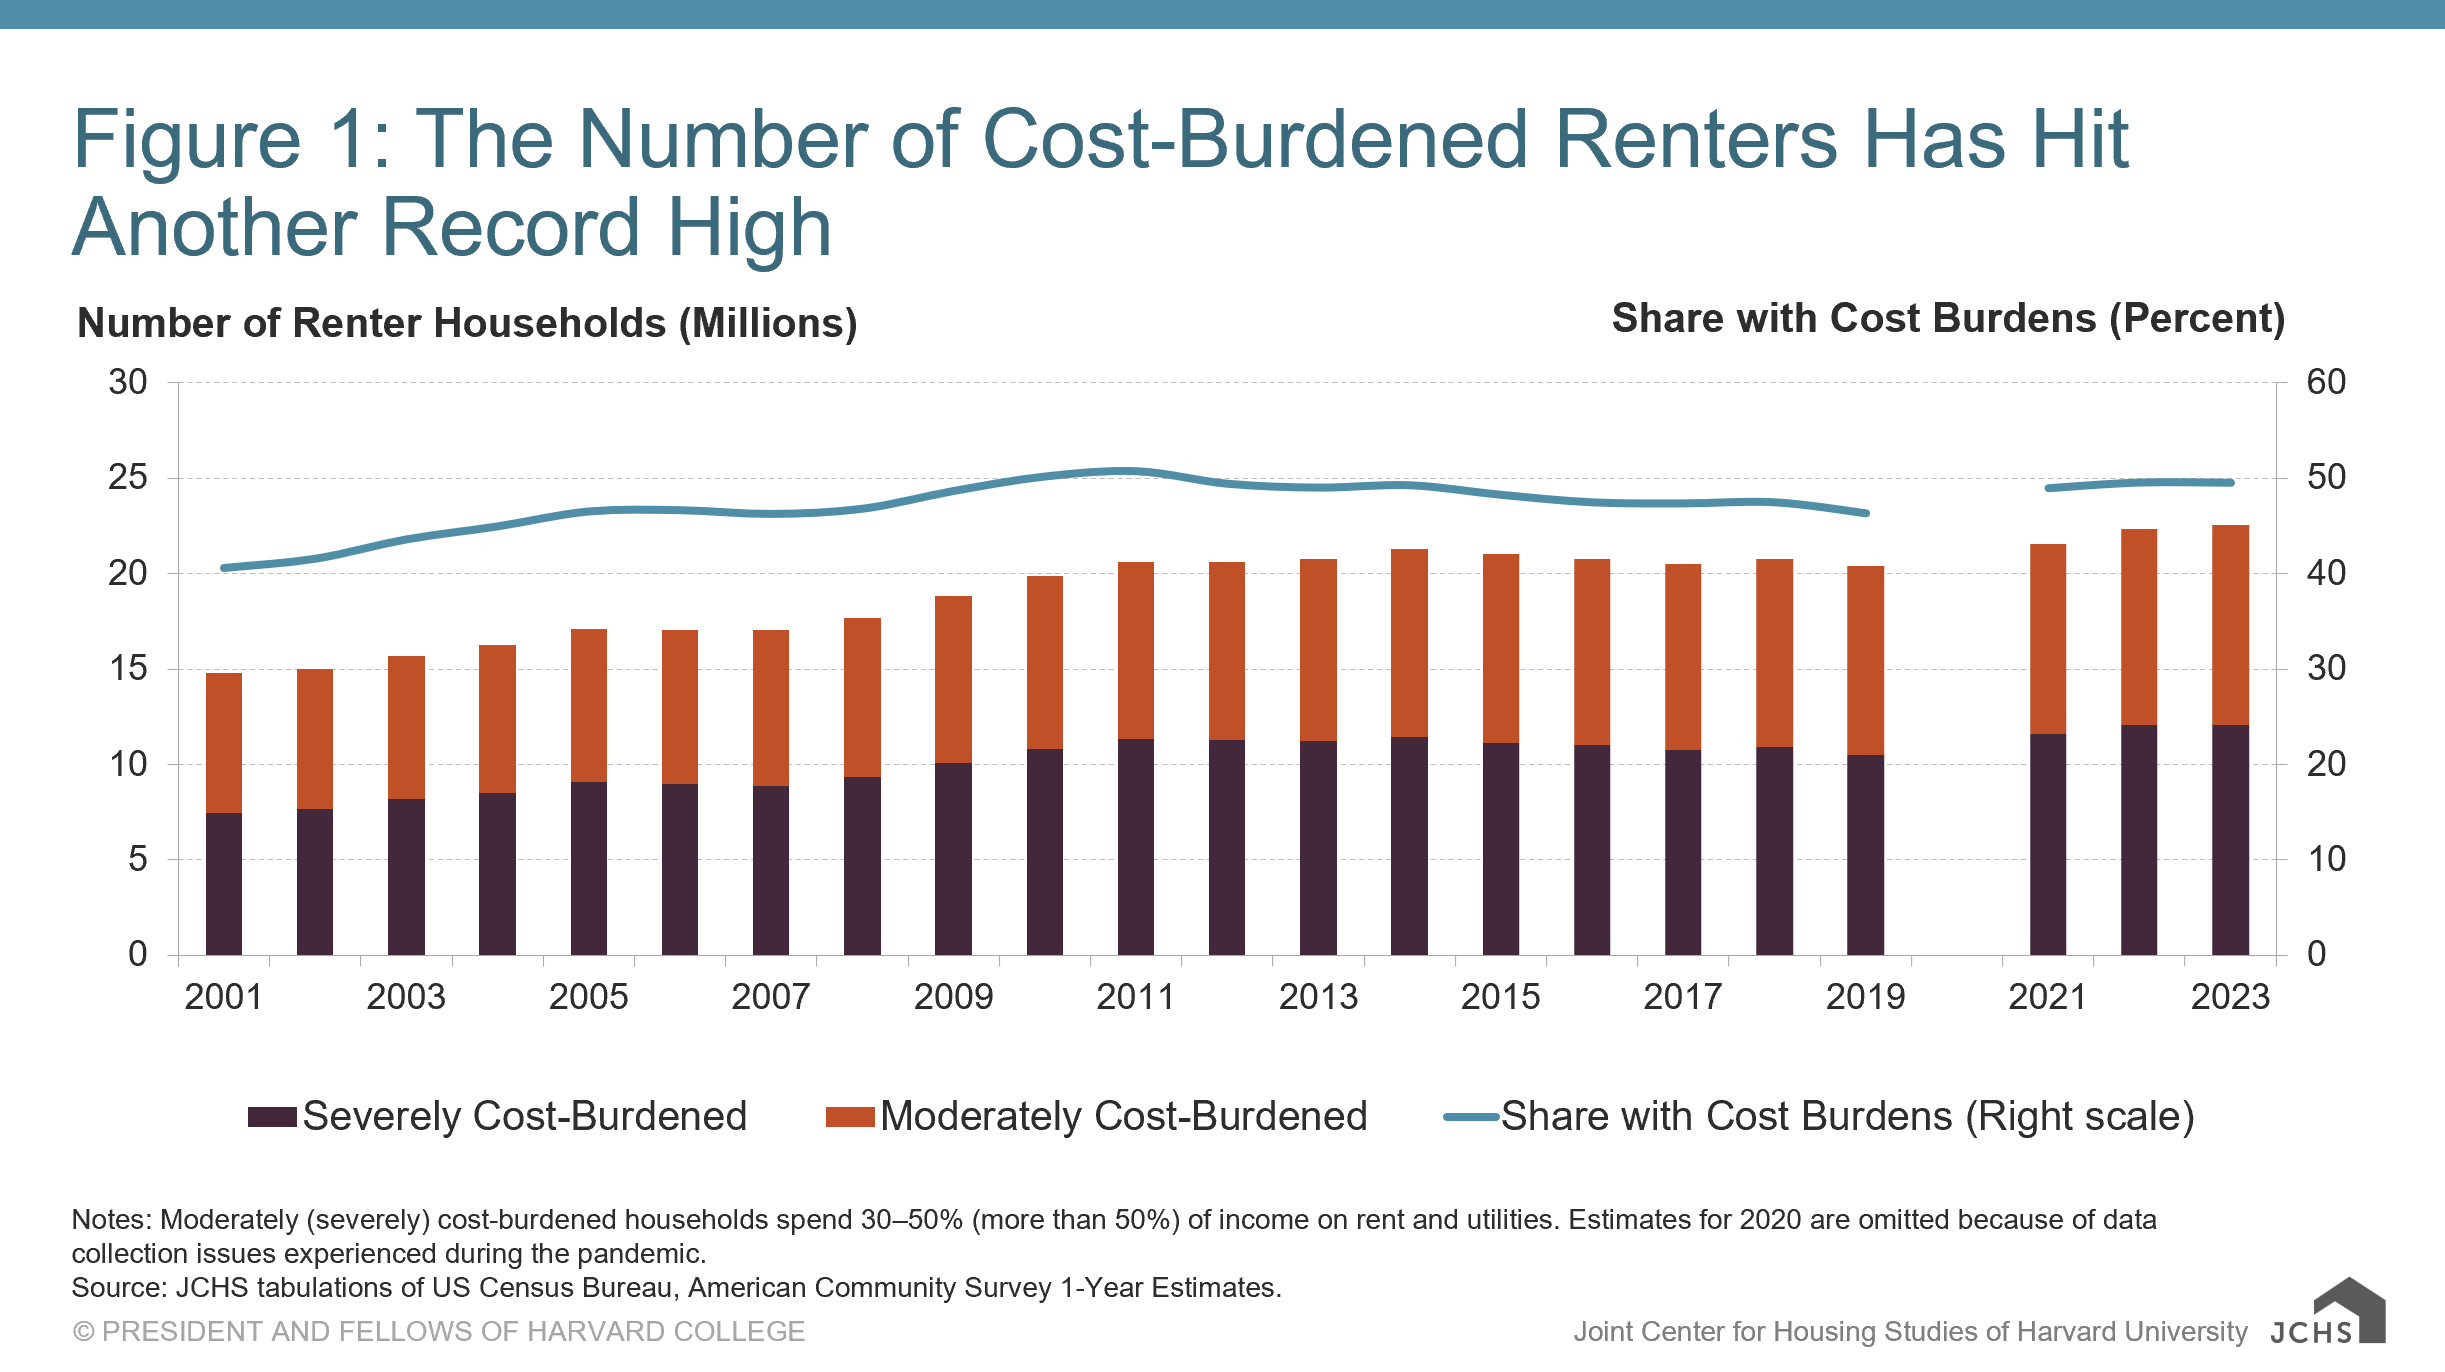
Notes: Moderately (severely) cost-burdened households spend 30–50% (more than 50%) of income on rent and utilities. Estimates for 2020 are omitted because of data collection issues experienced during the pandemic.
Source: JCHS tabulations of US Census Bureau, American Community Survey 1-Year Estimates.
Rapidly rising rents, driven by strong demand and undersupply, have led to worsening affordability at every level of household income. Renters making less than $30,000 saw their cost burden rate rise 1.5 percentage points since 2019 and 5.2 percentage points since 2001, reaching 83 percent (Figure 2). While middle-income renters are less likely to be cost burdened, their rates are rising the fastest. In 2023, 70 percent of renters earning $30,000–44,999 were burdened, an increase of 15.0 percentage points since 2001, including a 3.5 percentage point rise since 2019. Affordability challenges for renters earning $45,000–74,999 have grown even more dramatically with their burdens nearly doubling in two decades to 45 percent, which also marked an increase of 7.7 points since 2019. Even households earning more than $75,000 have not been insulated from deteriorating affordability with their cost burden rate rising to 13 percent in 2023, up 3.3 percentage points over the pandemic and 7.8 points since 2001.
Figure 2: Cost Burdens Are Rising for Renters of All Incomes
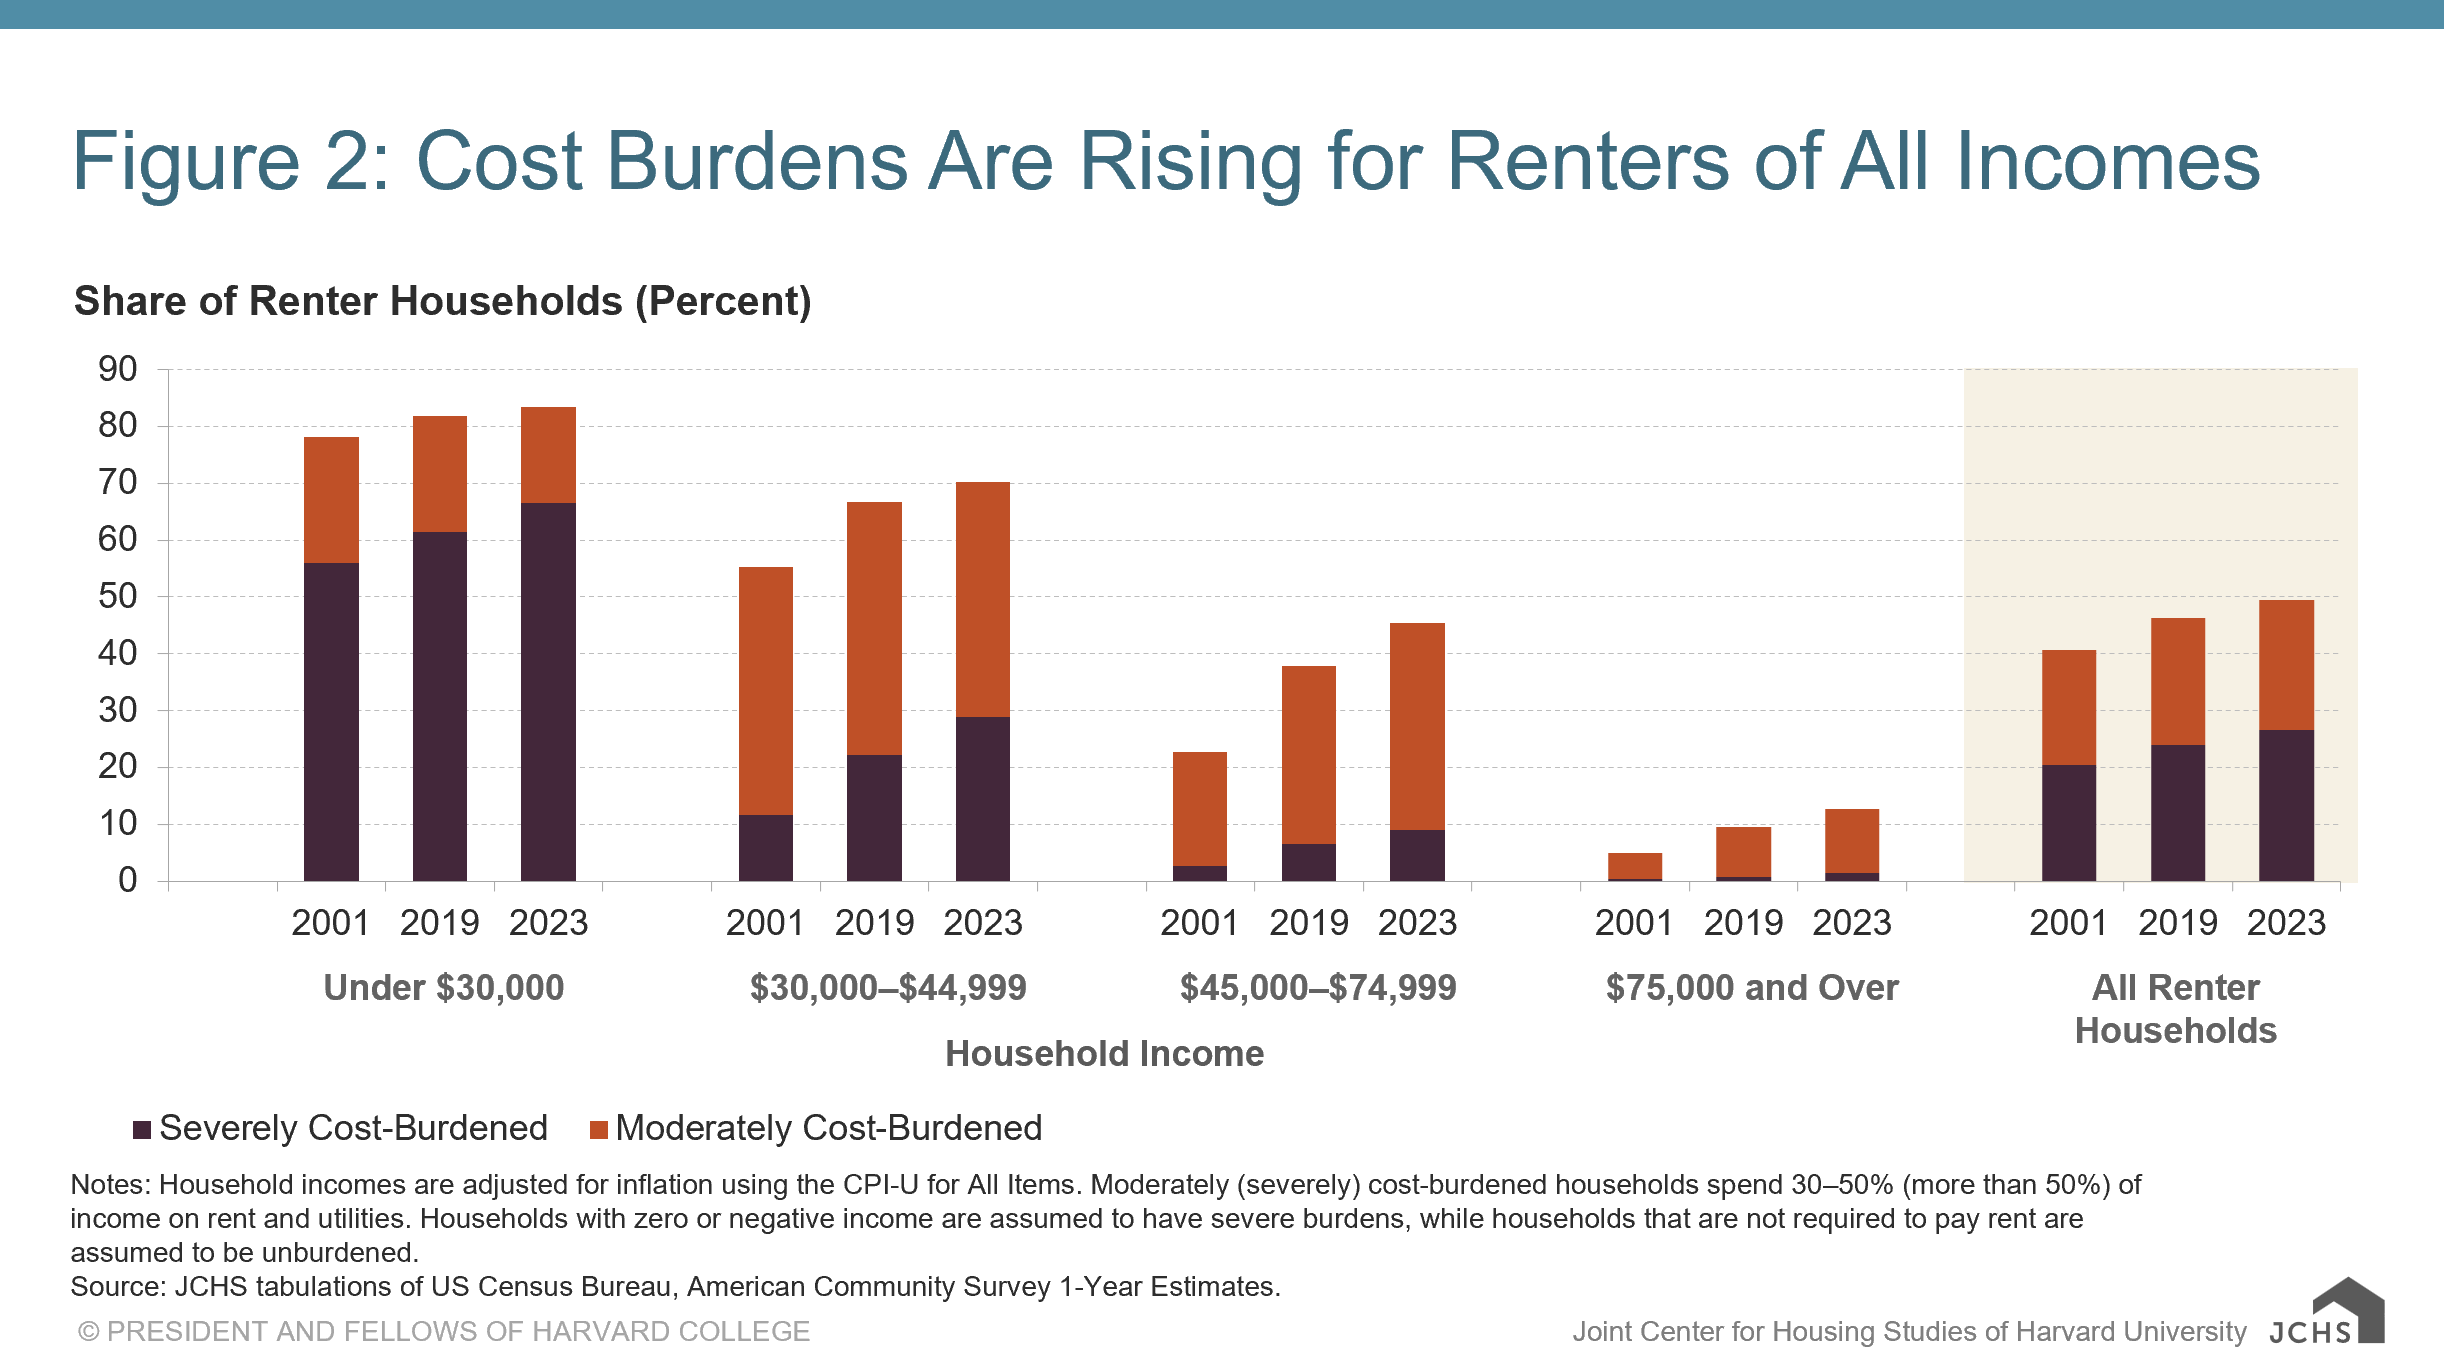
Notes: Household incomes are adjusted for inflation using the CPI-U for All Items. Moderately (severely) cost-burdened households spend 30–50% (more than 50%) of income on rent and utilities. Households with zero or negative income are assumed to have severe burdens, while households that are not required to pay rent are assumed to be unburdened.
Source: JCHS tabulations of US Census Bureau, American Community Survey 1-Year Estimates.
Increasing cost burdens across income groups reflects the fact that full-time work no longer guarantees that a household can afford housing. The share of fully employed renters—households headed by someone who worked at least 50 weeks in the prior year and 35 hours in a typical week—was under 25 percent in 2001. But as rents have skyrocketed, the share of fully employed renters with cost burdens climbed all the way to 36 percent last year. In 2023, over half of fully employed renters working in personal/care services (55 percent) and food preparation (54 percent) were cost burdened, along with high shares of renters working in office and administrative support (42 percent) and education (38 percent).
While cost burdens have climbed the income scale, lower-income renter households continue to bear the brunt of the affordability crisis. Among households earning less than $30,000, median rents rose 18 percent from 2001 to 2023 as their incomes fell by 12 percent, all in inflation-adjusted terms. These trends have pushed up the share of income these renters spend on housing. In 2023, lower-income renters dedicated a staggering 80 percent of their household incomes to rent and utilities, compared to 60 percent in 2001 and 68 percent in 2019. With this increase, their residual incomes—the amount a household has left over each month after paying rent and utilities—plummeted to a record low of $250, a 55 percent decrease since 2001 (Figure 3). Residual incomes for this group dropped 44 percent between 2019 and 2023 alone.
Figure 3: Residual Incomes for Lower-Income Renters Have Fallen Sharply
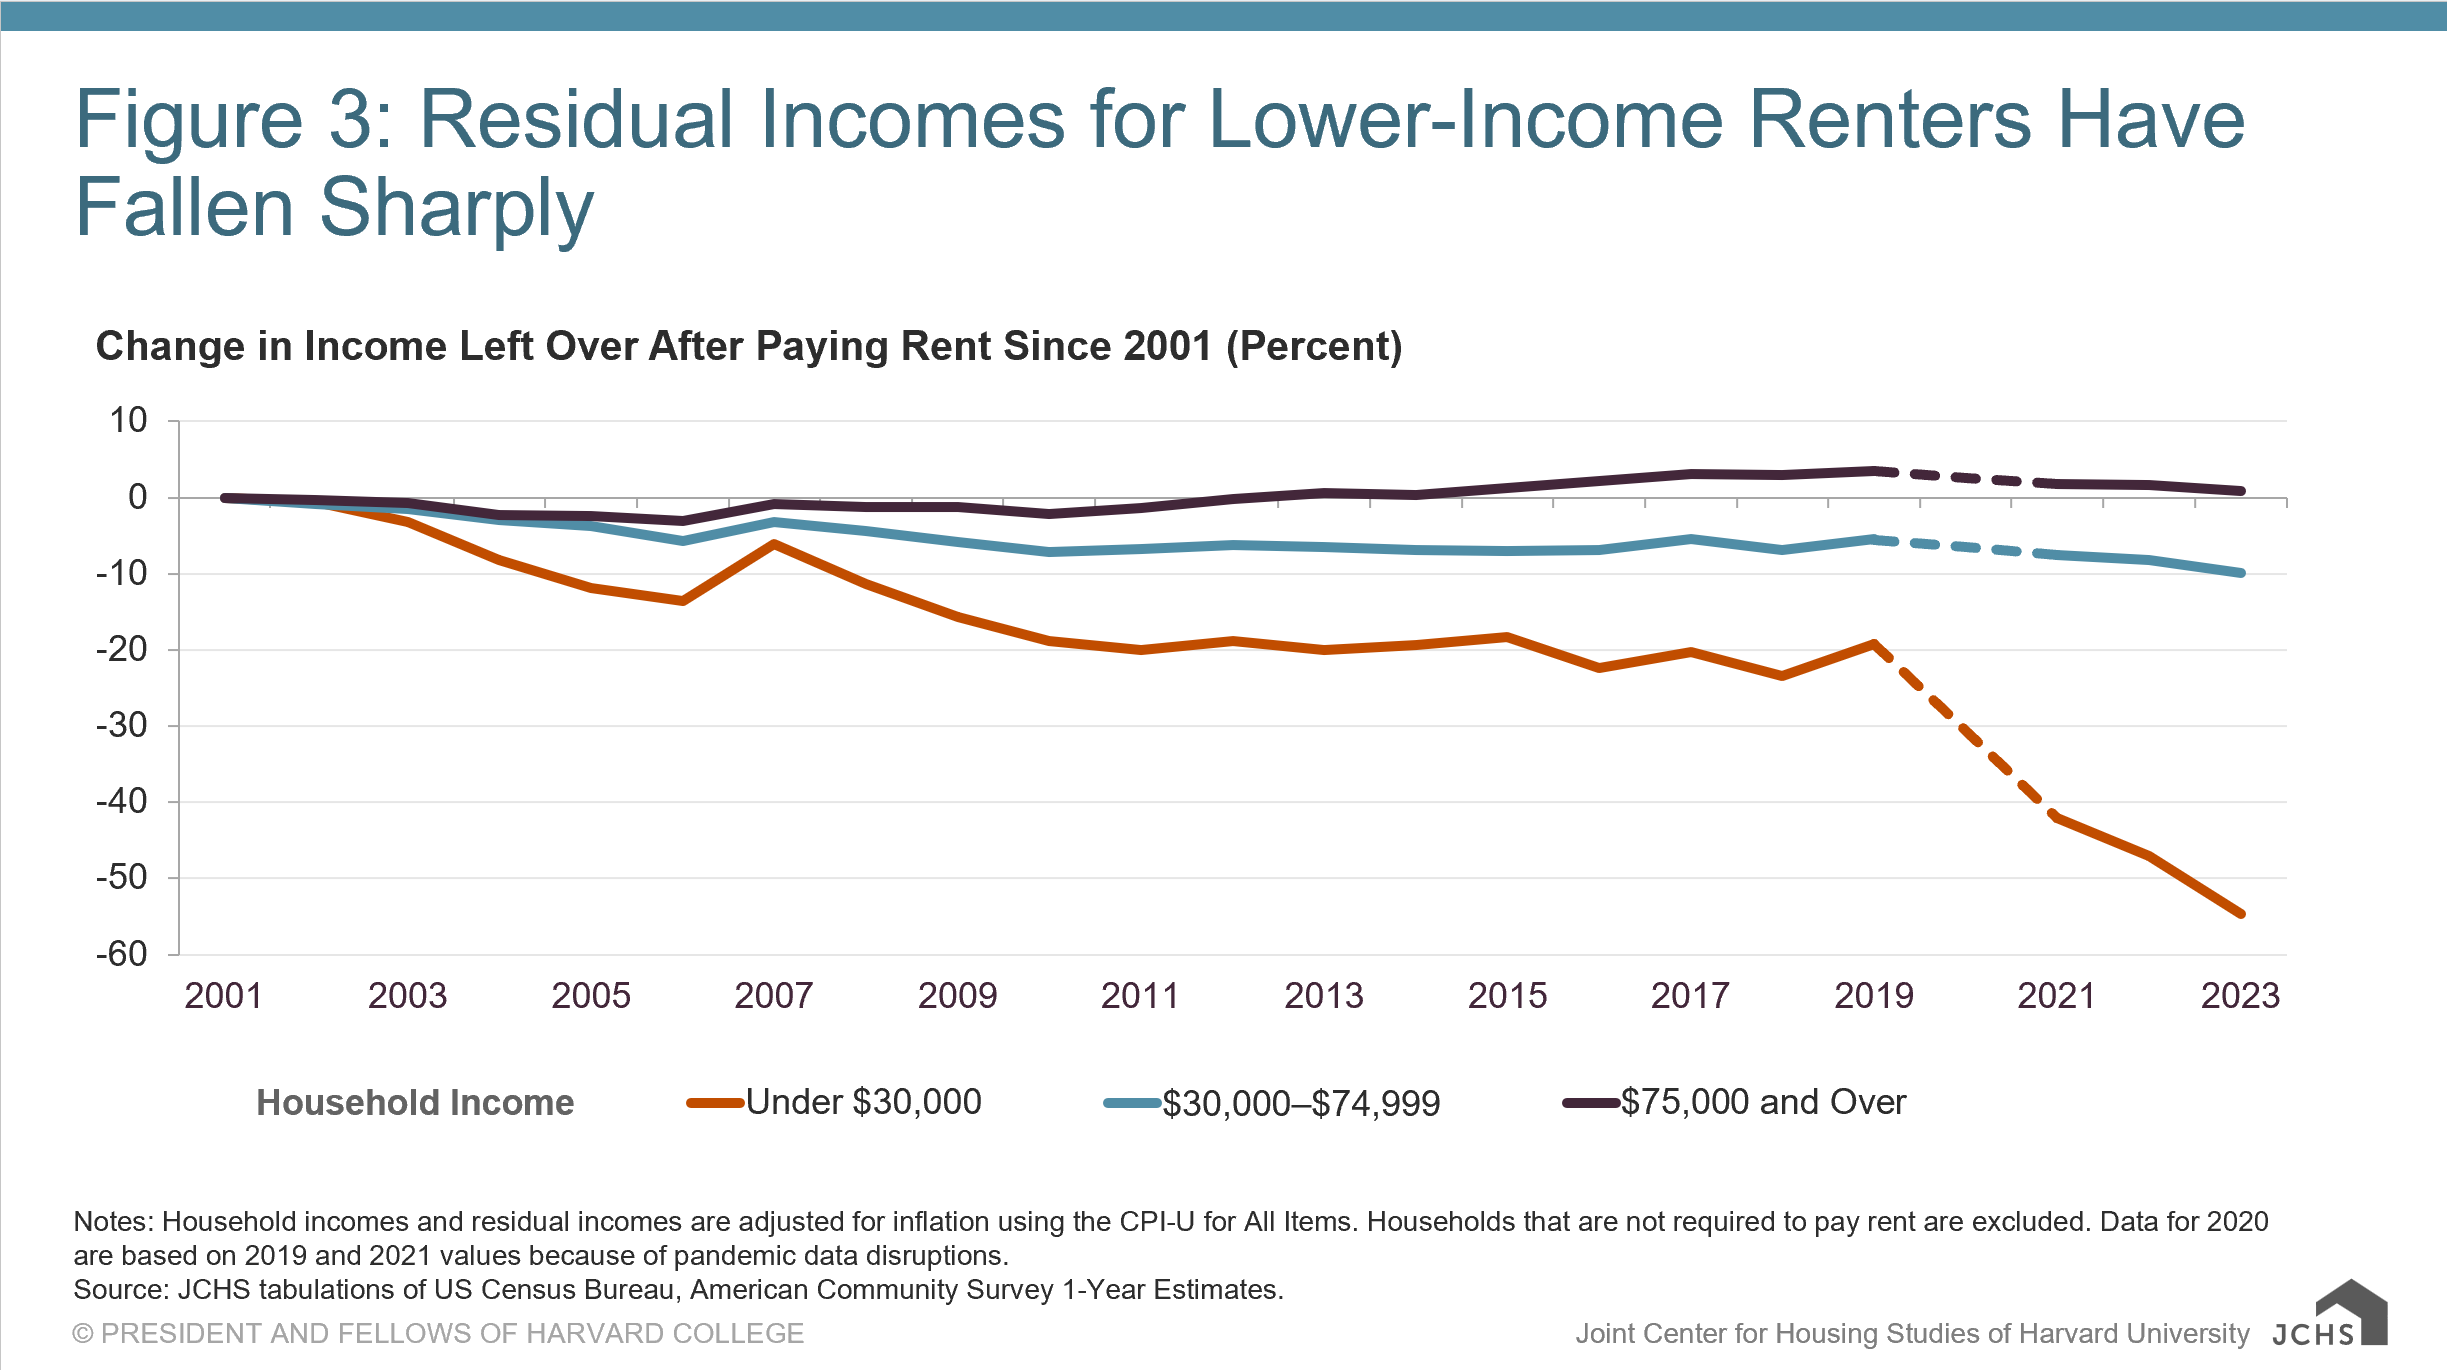
Notes: Household incomes and residual incomes are adjusted for inflation using the CPI-U for All Items. Households that are not required to pay rent are excluded. Data for 2020 are based on 2019 and 2021 values because of pandemic data disruptions.
Source: JCHS tabulations of US Census Bureau, American Community Survey 1-Year Estimates.
The upward shift of the rent distribution helps explain why lower-income renters live in increasingly unaffordable housing. Since 2013, the number of units with contract rents under $1,000 in inflation-adjusted terms has fallen by 7.5 million, including the loss of 2.5 million units renting for less than $600 and 2.5 million units renting for $600 to $799. Meanwhile, net additions have entirely been among units renting for more than $1,400. The number renting for $1,400 to $1,999 has risen by nearly 5 million since 2013 while the stock with rents of $2,000 or more increased by 5.5 million.
While the latest cost burden data come from 2023, the affordability challenges have likely continued. According to the Census’s Household Pulse survey, 41 percent of renters surveyed between January and September 2024 reported that their monthly rent had increased by at least $100 in the last year despite a boom in multifamily construction that is adding new units in many markets of the country. While rents are still going up, the multifamily housing surge has likely helped slow rent growth in some markets. But relief may be short lived as multifamily construction has slowed sharply while renter household growth is picking up. The construction slowdown will likely contribute to tightening markets that could push rents back up at a faster pace.
Ultimately, the future of rental affordability will depend on our ability to increase supply in constrained markets and increase subsidies that offset high rents for lower-income households. Affordability will also depend on the quality of employment opportunities that are available, prevailing wage trends, and the existence of policies that increase household incomes through the tax code or through guaranteed income programs.


