Number of Renters Burdened by Housing Costs Reached a Record High in 2021

In 2021, the first full year of the COVID-19 pandemic, a record number of renters were cost-burdened, spending more than 30 percent of their income on housing. In addition, more homeowners were burdened than at any point since 2012.
According to Center tabulations of newly released American Community Survey data, 40.6 million households—nearly one-third of all US households—spent more than 30 percent of their income on housing, an increase of 3.4 million compared to 2019. Most of the increase in cost burdens came from households who were severely burdened, or those who spent more than half of their income on housing. Fully 20.3 million households were severely burdened in 2021, an increase of 2.7 million from 2019.
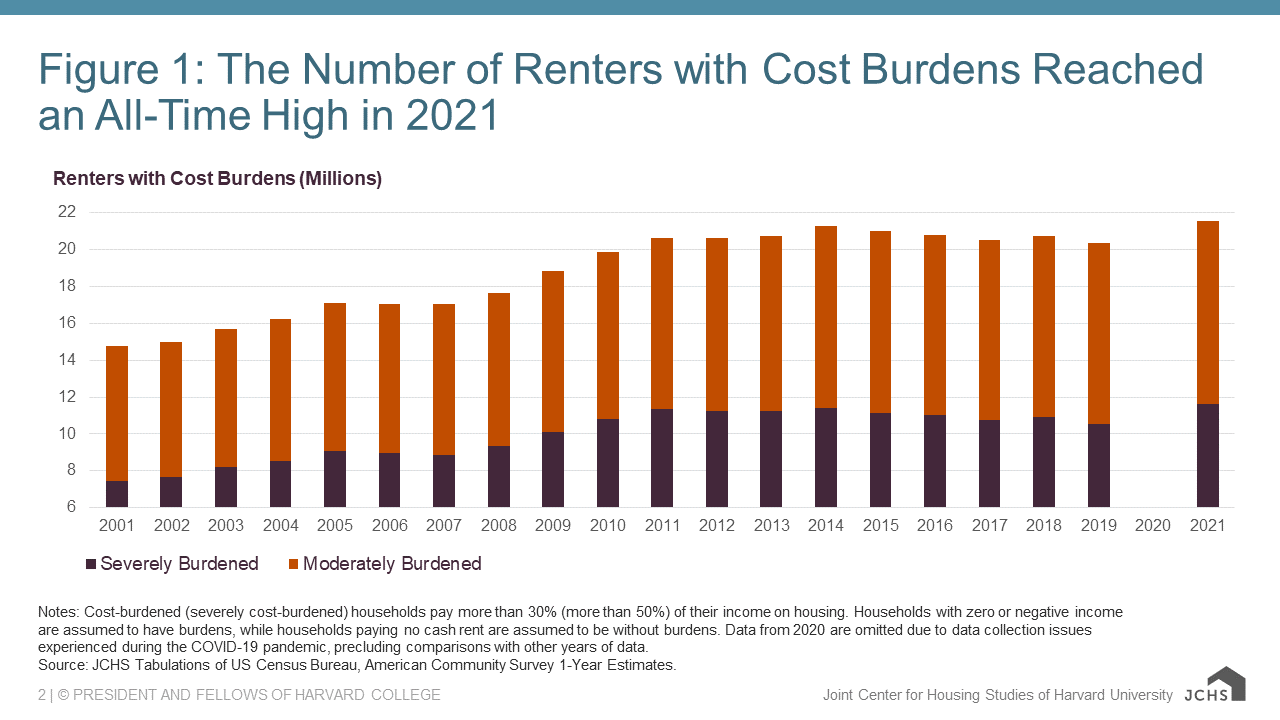
In 2021, more renters were cost-burdened than at any point in 20 years of data collection, with fully 21.6 million households experiencing burdens, or 49.0 percent of all renters. The number of burdened renters had previously peaked in 2014 at 21.3 million households before declining slightly to 20.4 million by 2019 (Figure 1). Of the overall 1.2 million increase in cost-burdened renters seen in 2021, 1.1 million of those were severely burdened.
Figure 1: The Number of Renters with Cost Burdens Reached an All-Time High in 2021
The significant increase in the number of cost-burdened renter households was in large part due to changes in the distribution of renter incomes since the beginning of the pandemic. Even after adjusting for inflation, the median income for renter households decreased from $44,500 in 2019 to $43,500 in 2021, a decline of 2.3 percent. Meanwhile, the number of lower-income renters making less than $30,000 annually increased by 223,000 households over that period, and the number of renters with incomes over $75,000 decreased by 280,000 households. This is a reversal from trends over the prior decade. Indeed, from 2010 to 2018, higher-income households accounted for over three-quarters of renter growth. Overall, this change in renter income distribution means there was a shift towards households that are much more likely to experience cost burdens, partially explaining the significant increase in burdened renters observed in 2021.
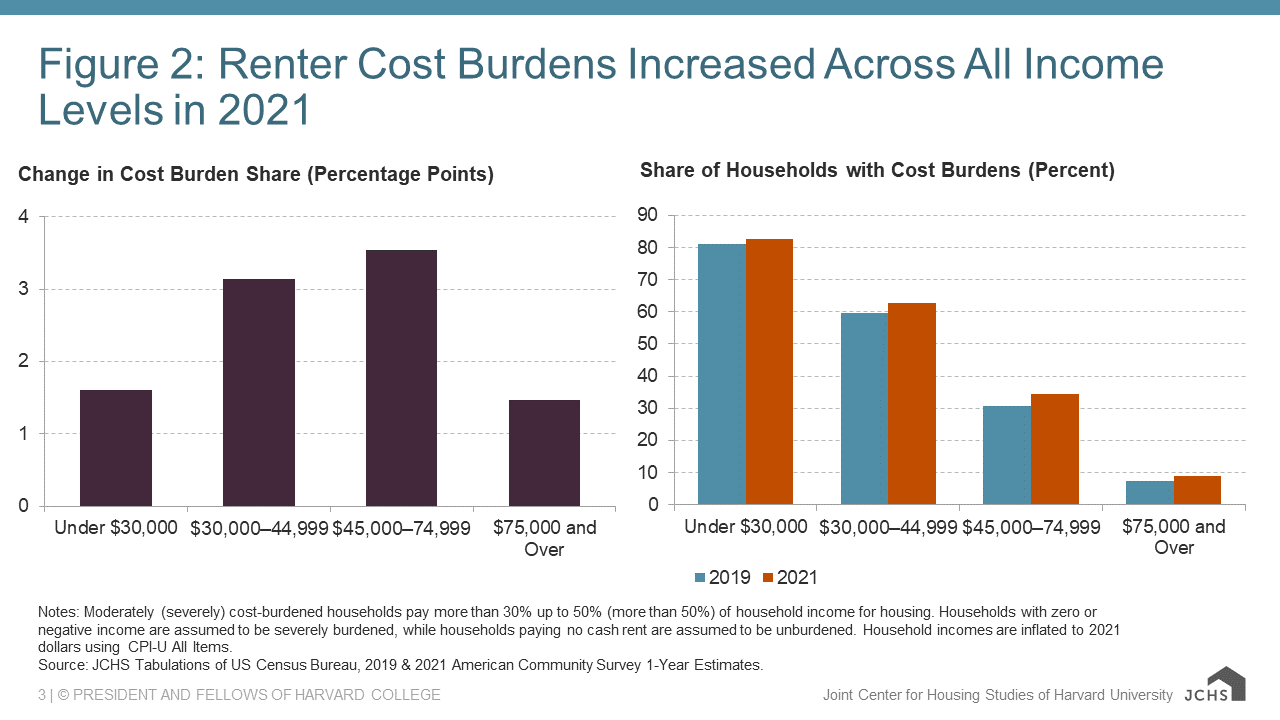
Declining renter incomes are only a piece of the story, though. Even within income groups, the share of cost-burdened renters increased significantly in 2021, and particularly for middle-income households. Renters with an income between $30,000 and $44,999 experienced a 3.1 percentage point increase in cost burdens to 62.7 percent, while households with incomes between $45,000 and $74,999 saw a 3.5 percentage point jump to 34.3 percent (Figure 2). Cost burden increases were somewhat smaller for lower-income renters, but these households still faced the highest overall share of cost burdens. Among renter households with a real income under $30,000, fully 82.7 percent were cost burdened, a 1.6 percentage point increase from 2019.
Figure 2: Renter Cost Burdens Increased Across All Income Levels in 2021
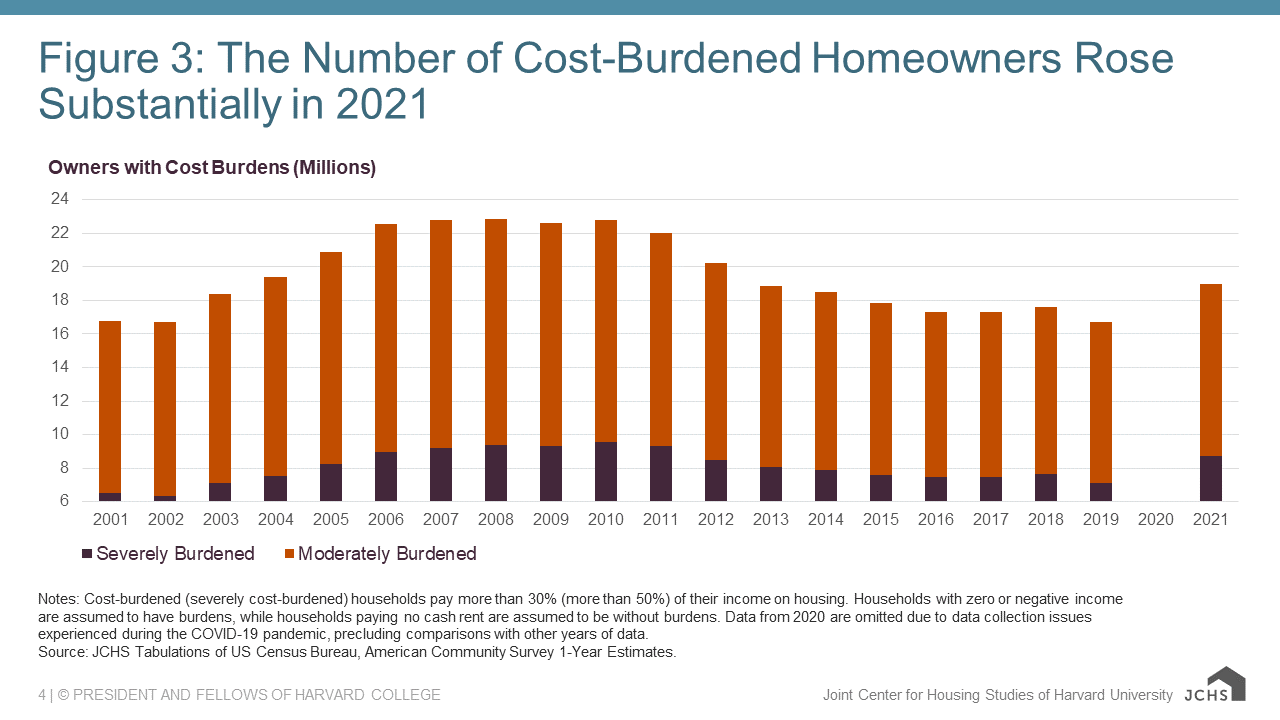
Declining incomes and rising costs also put pressure on many homeowners. Fully 22.8 percent of homeowners (about 19.0 million households) spent more than 30 percent of their income on housing in 2021, an increase of 1.5 percentage points (and 2.5 million households) since 2019. As with renters, severely burdened homeowners drove this growth almost entirely, accounting for 1.4 percentage points of the overall increase. Unlike with renters, however, these levels remained well below the record highs from the housing crisis of the mid-2000s (Figure 3). The number of homeowners who were cost burdened peaked in 2008 at 22.9 million, then steadily declined to 16.7 million by 2019. While the number of cost-burdened owners in 2021 remained well below 2008 record-high levels, this shift in long-term affordability trends is still a matter of concern.
Figure 3: The Number of Cost-Burdened Homeowners Rose Substantially in 2021
For the first time since the beginning of the pandemic, these data allow us to estimate the number of households with cost burdens using the American Community Survey. They show that market conditions during the pandemic, including surging home price and rent growth, contributed to affordability challenges for both renters and homeowners. The number of cost-burdened renters reached a two-decade high in 2021, while more homeowners were burdened than at any point since 2012. Taken as a whole, the data indicate the importance of programs targeted towards lower-income renters such as rental assistance and income supports. At the same time, there is clear need for strategies to increase the existing housing supply, which would keep housing costs in check and ultimately benefit households at all income levels.


