Non-Cash Rentals House More than Two Million Renters Affordably

An overlooked group in discussions of rental affordability are households who occupy a unit without payment of rent. Non-cash renters fall into one of three broad categories: (1) households living in homes on military bases (distinct from military barracks); (2) units provided for free in exchange for services or as a condition of employment; or (3) units provided for free to family or friends. Non-cash rentals are an important source of housing affordability, especially for lower-income and older-adult households with substantial affordability needs, but they are an under-researched segment of the rental market.
Who are non-cash renters?
In 2023, non-cash renters comprised over 2.1 million of the 45.6 million US renter households. While the number of non-cash renters has been steady over the past two decades, the share of non-cash renters has declined from a high of 6.3 percent in 2001 to a record-low 4.7 percent in 2023 (Figure 1). Non-cash renter households are more common in lower-cost states and less common in higher-cost states where there’s a greater incentive to rent out (or sell) a unit. In the 11 states where the non-cash renter share exceeded 8 percent (including Arkansas, Maine, and West Virginia), the median rent was $1,030 on average. In the 13 states where non-cash renters comprised under 4 percent of households (including California, New Jersey, and Washington) the median rent was $1,590 on average.
Figure 1: Number of Non-Cash Renters Has Held Steady for Two Decades as the Share of Non-Cash Renters Declines
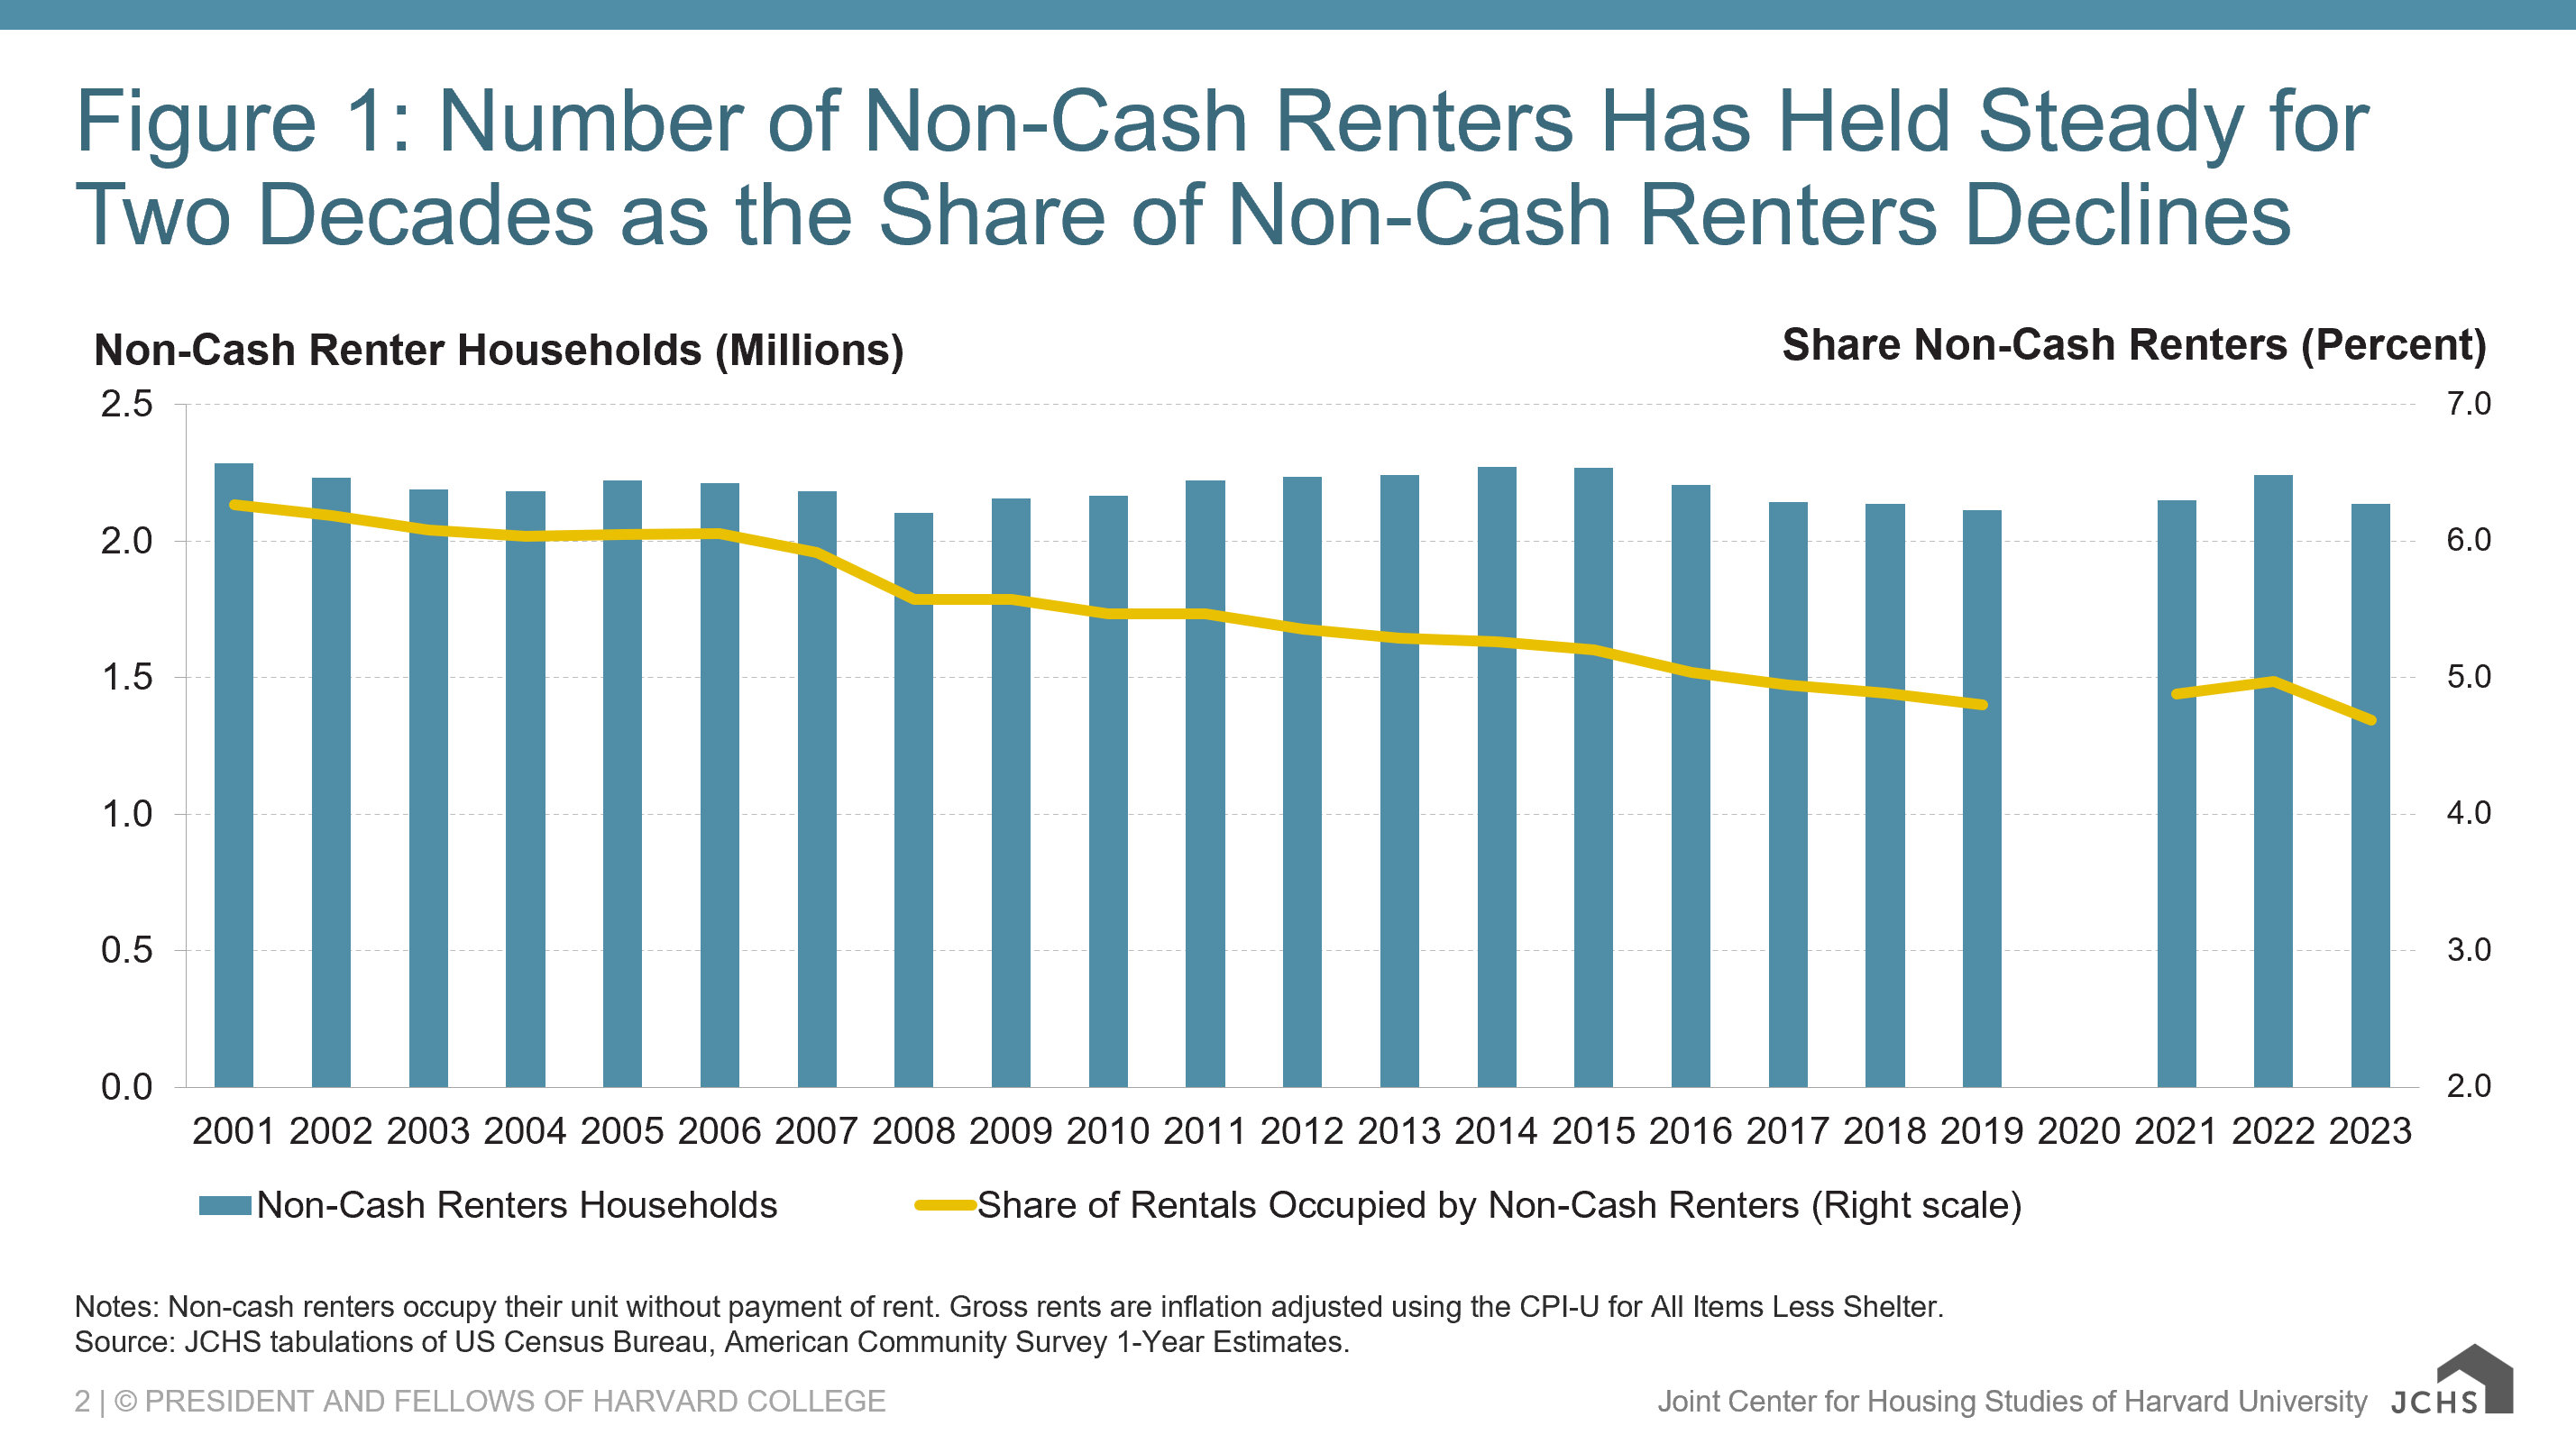
Notes: Non-cash renters occupy their unit without payment of rent. Gross rents are inflation adjusted using the CPI-U for All Items Less Shelter.
Source: JCHS tabulations of US Census Bureau, American Community Survey 1-Year Estimates.
Importantly, non-cash renters live in distinct rental units, so these arrangements exclude any household where the owner lives in the home, or situations where a roommate lives in the household rent-free but another tenant pays rent. Moreover, these households do not include situations where the rent is paid by someone other than the tenant. For example, non-cash renters do not include tenants with a housing subsidy like a voucher or arrangements where a parent covers the rental costs of their adult child. In these cases, rent is still paid to someone who owns the home. Instead, non-cash rentals are arrangements where the owner of a rental home does not receive payment of rent.
It’s impossible to identify how non-cash renters fall into each of the three broad categories. However, our estimates suggest that an outsized share of these renters live in homes owned by friends and family. Indeed, only a small fraction of renters lived on military bases: under 1 percent of both cash renters and non-cash renters were active-duty service members. Our estimates also suggest that only a modest share of non-cash renters live rent-free as a condition of employment. That’s because many non-cash renters are out of the labor force entirely—fully 42 percent of non-cash renters did not work in the past year, compared to 24 percent of cash renters.
By structure type, non-cash renters are far more likely to live in single-family and manufactured homes and less likely to live in apartments. Fully 68 percent of non-cash renters lived in single-family homes and 12 percent lived in mobile homes, while just 19 percent lived in multifamily structures. By comparison, about one-third of cash renters lived in single-family (29 percent) or manufactured (3 percent) housing units, while two-thirds (67 percent) lived in multifamily structures. Non-cash renters also tend to live in older homes; 60 percent of non-cash rentals were built before 1980, relative to 49 percent of cash rentals.
Non-cash renters were also disproportionately lower income, the kinds of households that would benefit most from non-cash rental arrangements. Over 42 percent of non-cash renters earned under $30,000 in 2023, 13 percentage points higher than the share of cash renters with such low incomes (Figure 2). On the flip side, 24 percent of non-cash renters earned at least $75,000, 9 percentage points lower than cash renters.
Non-cash renter households were generally older as well, even as cash renters skewed younger. Nearly one-third of non-cash renters were headed by someone age 65 or older, twice the rate of cash renters. Similarly, just 21 percent of non-cash renters were headed by an adult under age 35, compared to 36 percent of cash renters.
Figure 2: Non-Cash Renters Are More Likely to Be Lower-Income and Headed by an Older Adult
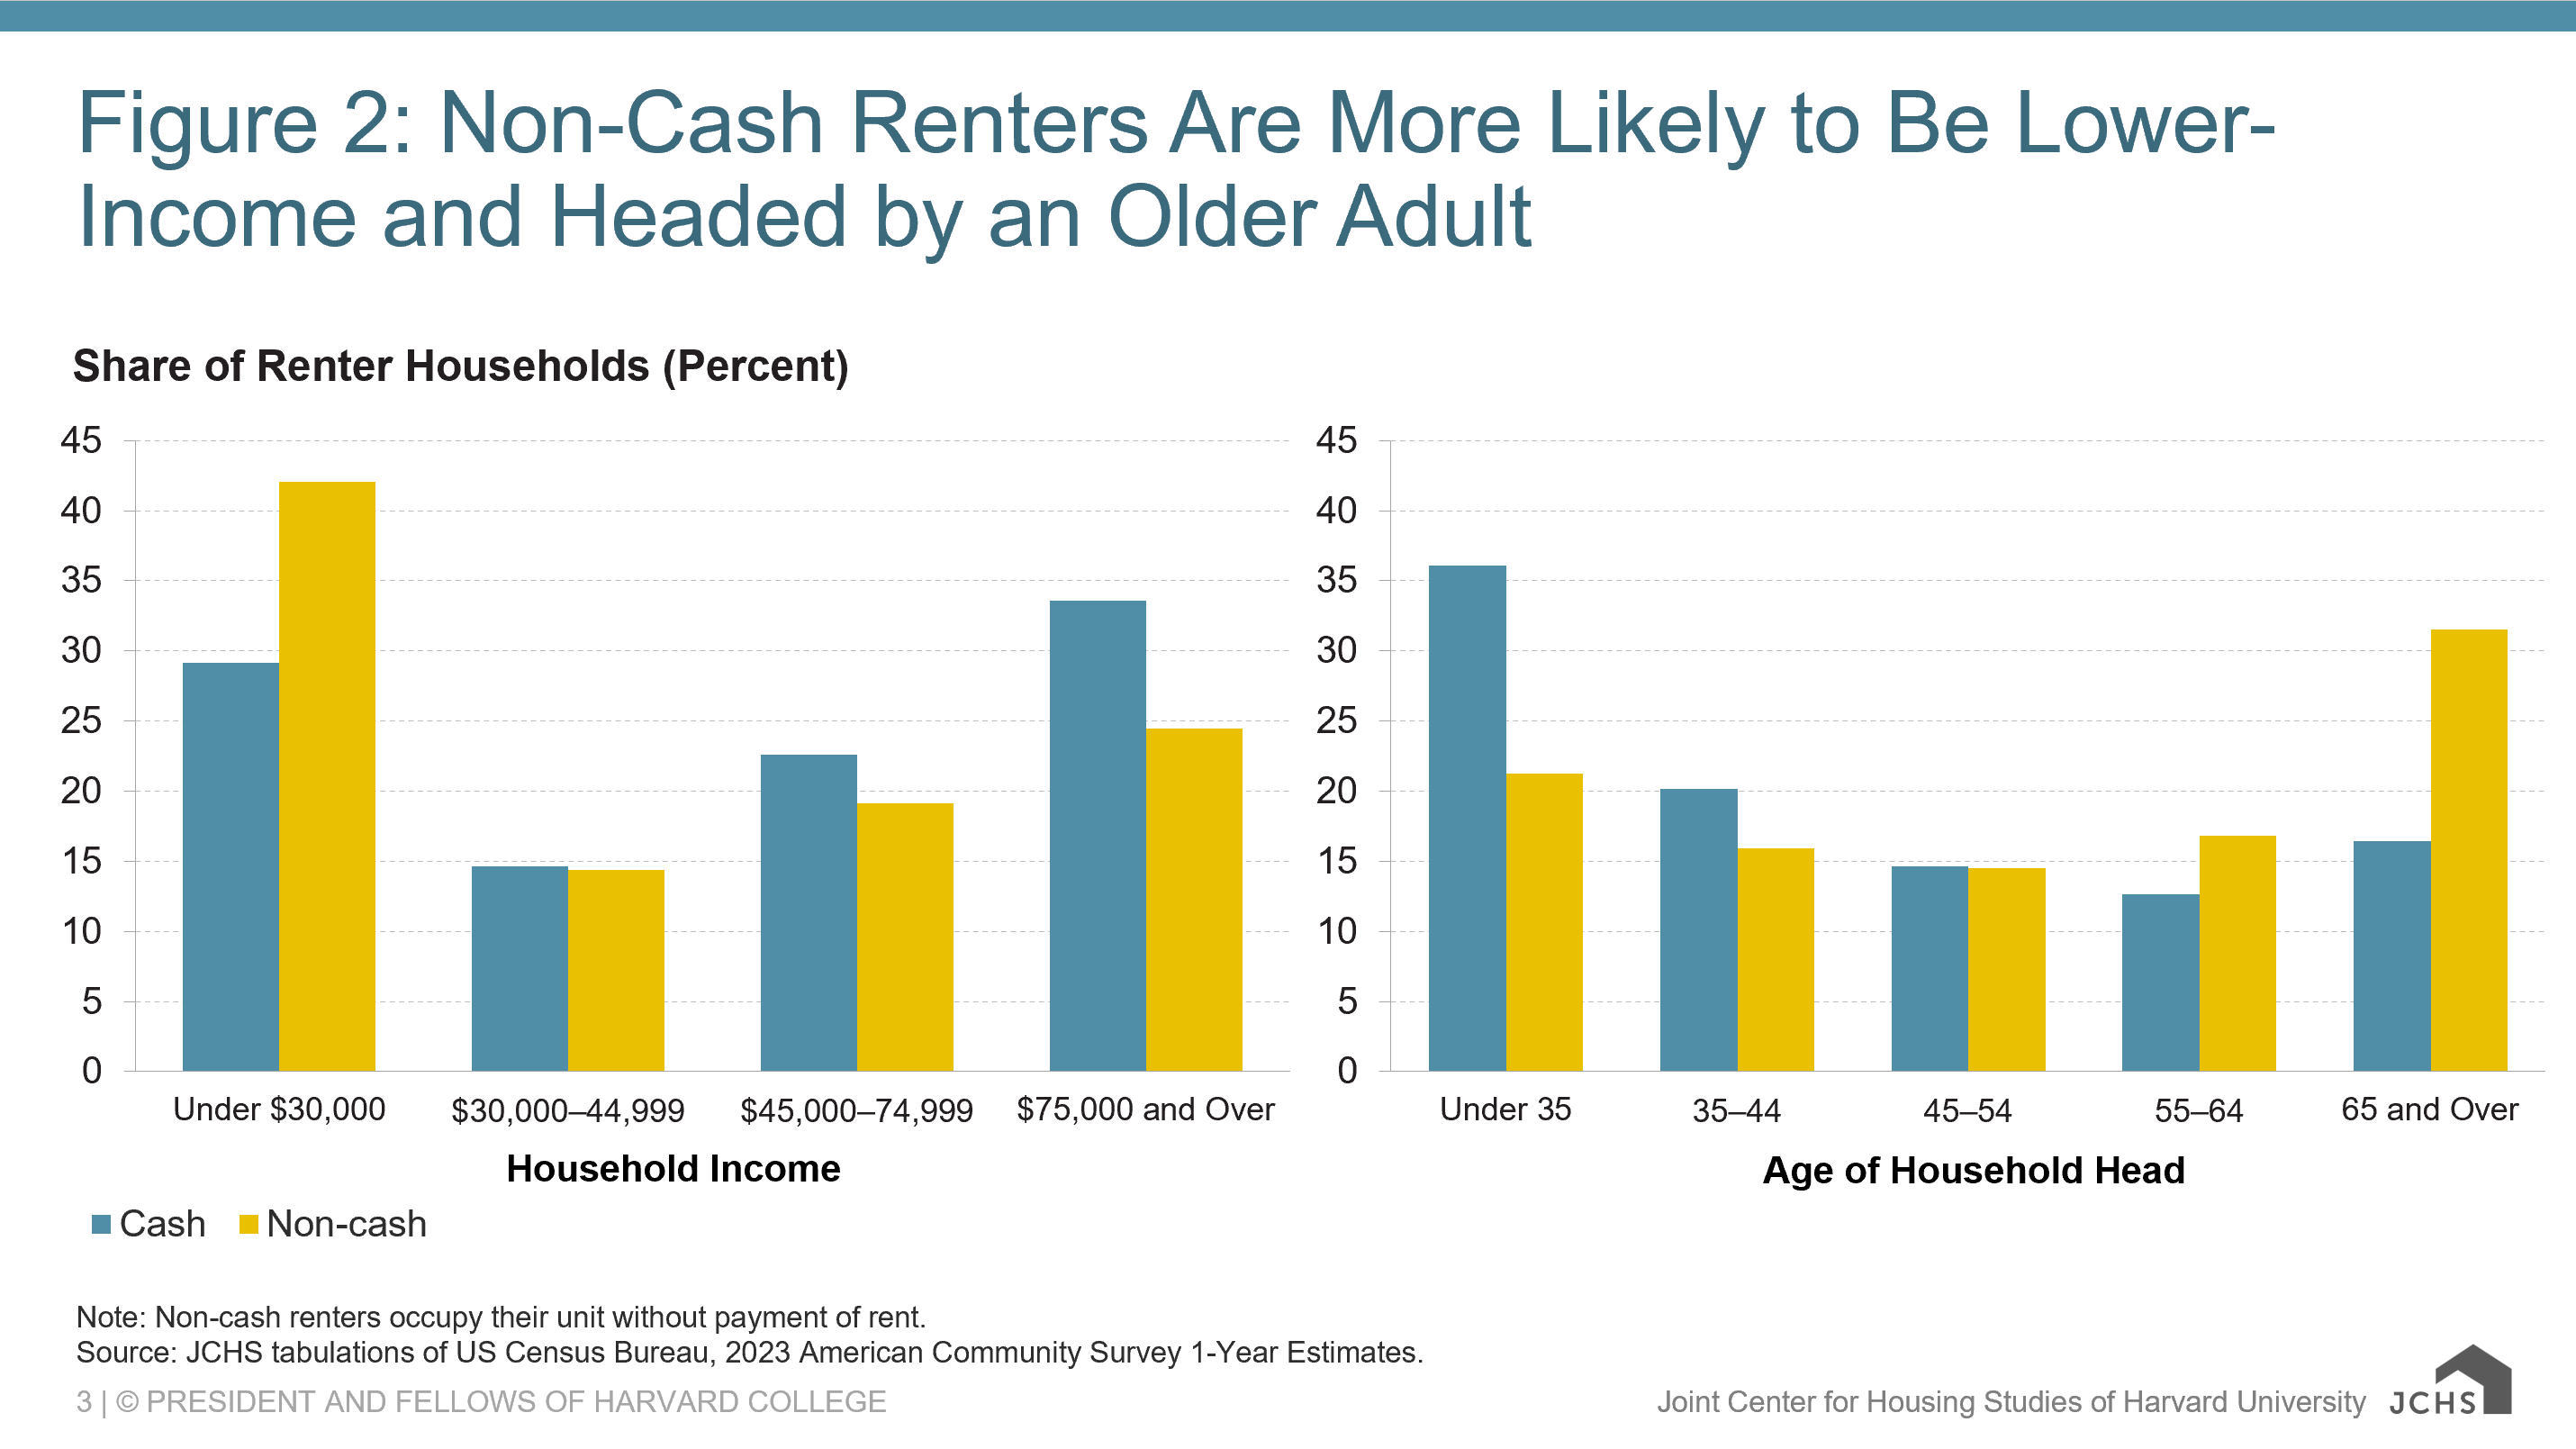
Note: Non-cash renters occupy their unit without payment of rent.
Source: JCHS tabulations of US Census Bureau, 2023 American Community Survey 1-Year Estimates.
Many other characteristics of non-cash renters follow from their relative age and income. Consistent with lower incomes, non-cash renters were less likely to have a bachelor’s degree than cash renters (24 percent vs. 32 percent). Mirroring the household structure of many older adults, non-cash renters were more likely to live alone (43 percent vs. 40 percent) or be married couples without children (20 percent vs.13 percent). Just 20 percent of non-cash renters have children under 18 in the household compared to 25 percent of cash renters.
Also consistent with their ages, non-cash renters were disproportionately headed by a white person and less likely to be headed by a person of color. Indeed, 63 percent of non-cash renters were headed by a non-Hispanic white person, while 14 percent were headed by a Hispanic person and 13 percent were headed by a Black person. Conversely, 48 percent of cash renters were headed by a white person, 21 percent by a Hispanic person, and 19 percent by a Black person.
What are the implications for affordability?
Non-cash rentals prevent several million renters from experiencing cost burdens every year. In 2023, 52 percent of cash renters were cost burdened, with rates particularly high among older adult households (63 percent) and lower-income renters earning under $30,000 annually (89 percent). In our estimates, all non-cash renters are categorized as without burdens. However, if these non-cash renters paid just the 25th percentile rent in their state, 50 percent would be cost burdened; if they paid the median rent, fully 62 percent would have burdens.
Non-cash rental arrangements offered 2.1 million households an affordable living situation and, as a result, these households are not competing with lower-income tenants in the private market for the limited supply of lower-cost rentals. But the majority of renters with affordability challenges lack access to such arrangements. Record-high cost burdens and an increasingly unaffordable housing market reinforce the importance of expanding the lower-cost housing stock and adequately funding the rental assistance programs that benefit a broad swath of lower-income renters.


