New Data Suggest a Modest Increase in Homeownership and Household Growth Over the Past Year

The Census Bureau’s Housing Vacancy Survey (HVS) is widely used to track trends in US homeownership rates, vacancy rates, and household growth on a quarterly basis throughout the year. However, changes to the survey made in response to the pandemic have made it largely unable to track these important metrics for housing demand for almost a year. In its latest release, however, the HVS has provided new, supplemental data that suggest homeownership rates likely rose, vacancy rates fell, and household growth continued over the past year – just not quite at the levels originally reported.
As described in a detailed announcement on the HVS website, in March of 2020 the pandemic forced Census to halt in-person visits by HVS surveyors for safety reasons. These in-person visits are used to gather additional information when a household fails to respond to a survey, which became more common over the past year. Specifically, the survey taker visits to determine if the lack of response is because the unit is vacant and, vacant or not, if that unit is a rental or owner-occupied.
Halting in-person visits greatly affected the HVS results in 2020. First, it led to a spurious drop in the survey’s vacancy rate which, in turn, led to a jump in households. Additionally, homeownership rates were unusually high because it appears renters were less likely to answer the survey than owners. With no one on the ground to investigate, the survey’s ability to measure household growth and homeownership rate trends since the pandemic began was compromised.
The HVS resumed in-person interviews in July but not in all areas, so the third and fourth quarter data are still not comparable to those from a year ago. However, with the fourth-quarter data release the HVS provided some supplemental statistics on the subset of areas that are comparable – i.e. where in-person interviews were allowed in both Q4 2019 and Q4 2020. Data from this subset suggests that the US homeownership rate likely increased over the past year, but less than the headline amount HVS published using the full dataset. Specifically, we see that the homeownership rate in the supplemental data increased 0.4 percentage point between Q4 of 2019 and Q4 of 2020, compared to the reported 0.7 percentage-point increase published by HVS using the full sample (Figure 1).
Figure 1: New HVS Data Show the US Homeownership Rate Probably Rose Last Year, but Not as Much as Originally Published
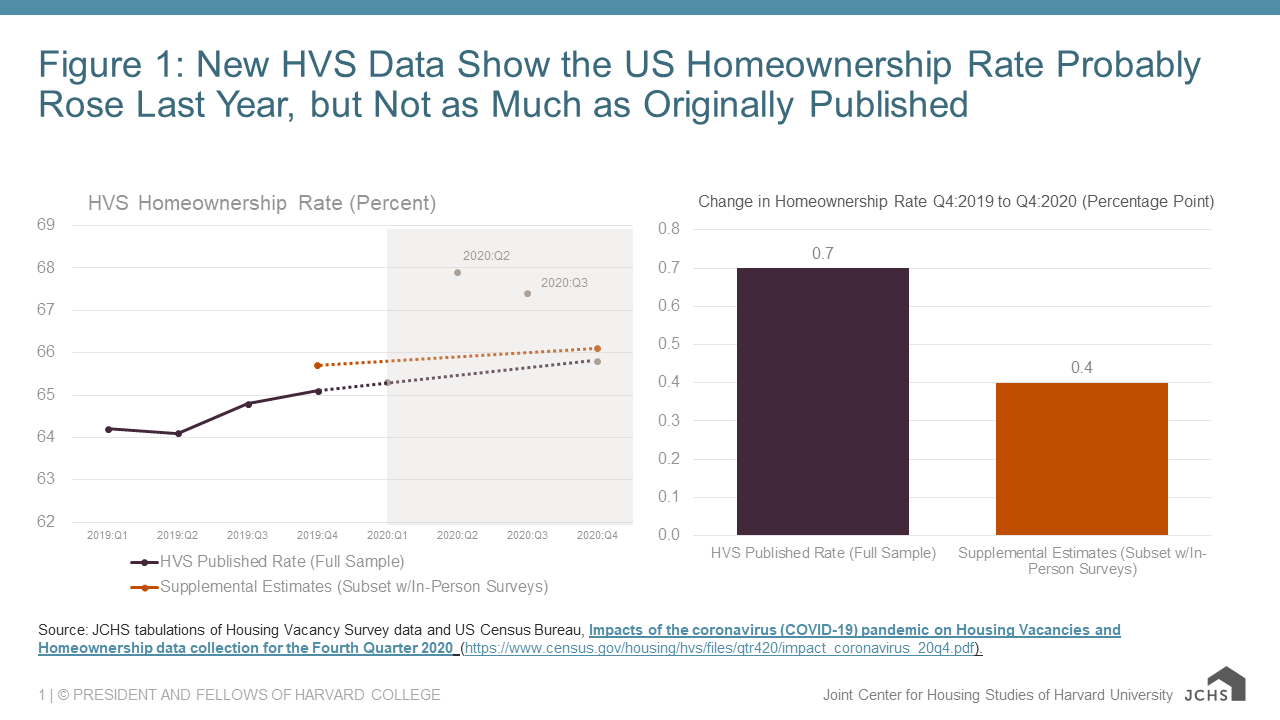
Source: JCHS tabulations of Housing Vacancy Survey data and US Census Bureau, Impacts of the coronavirus (COVID-19) pandemic on Housing Vacancies and Homeownership data collection for the Fourth Quarter 2020.
A couple of items are important to note when looking at this data. First, even though it is a large subset that covers 94 percent of all areas surveyed, we can see in Figure 1 that the homeownership rate in this supplemental data is slightly higher than the rate in the full 100-percent sample, so there may still be some differences that limit how much of the changes in the supplemental data can be applied to the full dataset. Second, we note that the increase in the homeownership rate over the past year in the supplemental data was less than the 0.6 percent margin of error reported in table 3 of the Census announcement, so we cannot even be 90 percent sure that the homeownership rate increased at all over the last four quarters. Still, the data suggest that any decline during this period would have been negligible at most, which is still striking given the pandemic.
Supplemental data also show much less of a decline in the vacancy rate than do the full sample data between the fourth quarter of 2019 and the fourth quarter of 2020 (Figure 2). Compared to a 0.6 percentage point decline in the full sample, the supplemental data show a 0.3 percentage point decline in the subsample that received in-person visits.
Figure 2: The Supplemental Data Also Show the US Vacancy Rate Probably Declined Less Than Originally Published…

Source: JCHS tabulations of Housing Vacancy Survey data and US Census Bureau, Impacts of the coronavirus (COVID-19) pandemic on Housing Vacancies and Homeownership data collection for the Fourth Quarter 2020.
A smaller decline in the vacancy rate over the past year would mean less growth in the number of occupied households than originally published. Specifically, it would lower the annual household growth in the fourth quarter from the originally reported 1.85 million to 1.46 million, which would be more in line with pre-pandemic levels (Figure 3). Additionally, the 0.3 percentage point margin of error on the change in vacancy rate in the supplemental data suggests a range of annual household growth from 1.0 million to 1.9 million, which underscores that this estimate is imprecise, but also that household growth over the past year may have been substantial.
Figure 3: …Which Suggests Annual Household Growth in 2020 Was Still Inflated by HVS in Q4, but Possibly Sizable Given the Margin of Error
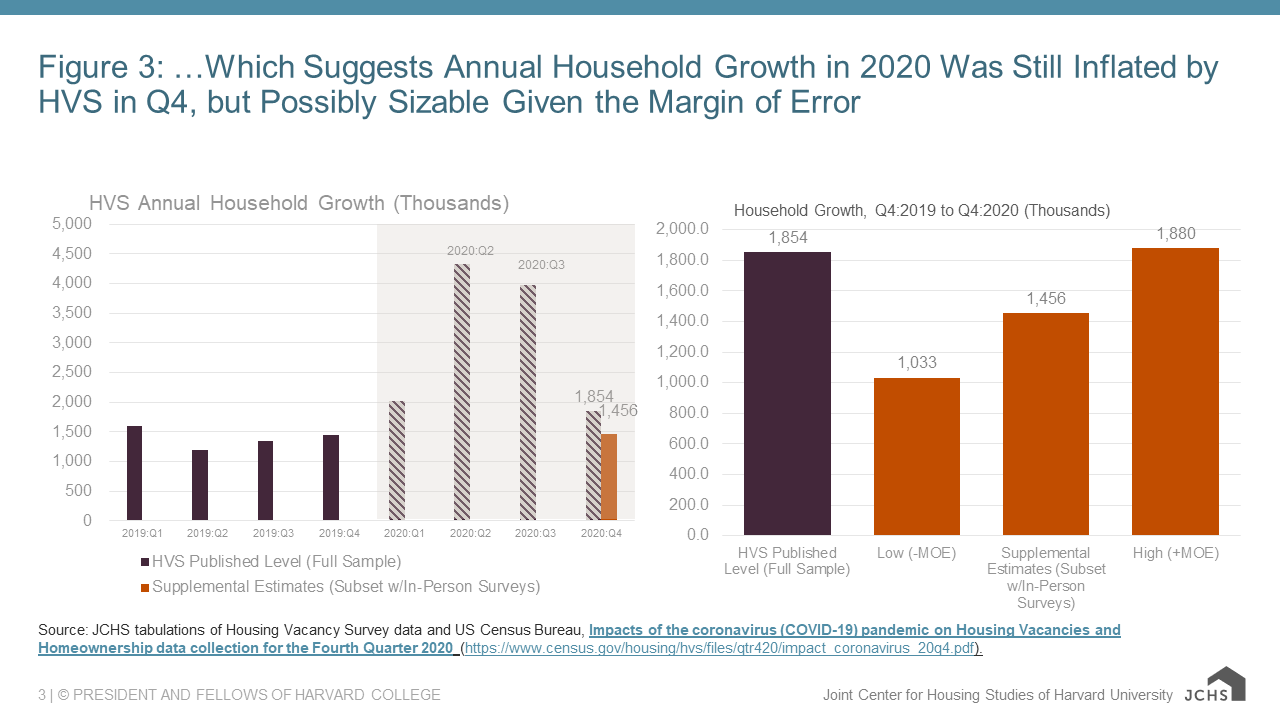
Source: JCHS tabulations of Housing Vacancy Survey data and US Census Bureau, Impacts of the coronavirus (COVID-19) pandemic on Housing Vacancies and Homeownership data collection for the Fourth Quarter 2020.
With the return of in-person sampling to nearly all areas, the HVS homeownership rates, vacancy rates, and household estimates for the fourth quarter of 2020 have gotten closer to being comparable to pre-pandemic data, but not completely. As with so much of the world and the economy these days, the extent to which the HVS returns to normal operations depends on the course of the pandemic. Clearly, the survey remains shrouded in imprecision and imperfection, so users need to continue to take extreme care in using it. However, thanks to the supplemental data, it appears we have a better ability to gauge changes in these important metrics for housing demand than we did a few months ago.


