Millions of Renters Fall Short of a Comfortable Standard of Living
Pandemic-related income losses, rising housing costs, and inflation in the cost of basic necessities have put a comfortable standard of living out of reach for many Americans. But in a newly published paper in Housing Policy Debate, Alexander Hermann, Sophia Wedeen, and I found that even before the pandemic more than 19 million working-age renter households struggled to meet their expenses.
Our work uses the residual income approach for measuring housing affordability. In the United States, the ratio of housing costs to income is the most widely used affordability measure in housing policy and research. In Center reports, we classify households as cost burdened if they spend more than 30 percent of their incomes on rent and utilities each month. This approach is easy to calculate but it does not account for the full spending needs of different households. For example, the 30 percent standard assumes that two households with same incomes can afford the same monthly rent, even if one of the households had five members and more expenses than a single-person household.
The residual income approach provides an alternative measure of housing unaffordability. According to Michael Stone, a longtime proponent of this method, residual income is the amount needed to cover all other expenses after paying for housing. In our paper, we used a modified version of the Economic Policy Institute’s 2018 Family Budget Calculator to estimate how much households would need to afford a comfortable standard of living. Using the 2018 American Community Survey, we subtracted each household’s housing costs from their reported monthly income. If the remainder was not enough to cover the estimate for all other expenses, we classified the household as having residual-income cost burdens.
In our sample of households with one or two working-age adults and with zero to four children (30.9 million or 71 percent of all renter households), 19.2 million had residual-income cost burdens. This was significantly higher than the 14.8 million who were considered cost burdened under the 30 percent standard.
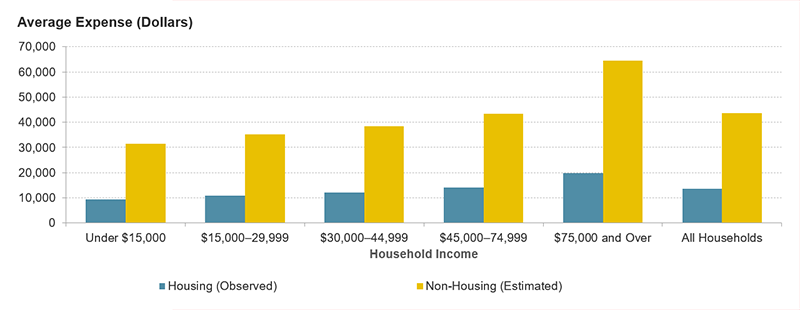
On average, households need more than $40,000 per year to cover their non-housing expenses (Figure 1). And even the smallest household in the most affordable county in the US would need at least $18,000 to cover their non-housing expenses. The lowest-income households, which tend to be smaller, would also need about $30,000 on average each year, an amount that is well above their actual incomes. As a result, nearly all of the households with incomes under $30,000 have residual-income cost burdens.
Figure 1: Working-Age Renter Households Need More Than $40,000 to Cover Non-Housing Expenses
Notes: Actual monthly housing expenses are observed in the American Community Survey and include rent and utilities. Non-housing expenses are estimated based on the modified Economic Policy Institute Family Budget Calculator data.
Sources: Author tabulations of US Census Bureau, 2018 American Community Survey 1-year estimates; and Economic Policy Institute, Family Budget Calculator.
Most households with residual-income burdens do not have nearly enough income to cover a comfortable standard of living. The average residual-income burdened household falls short by about $25,000 annually. The lowest-income households would need $34,000 to make up the difference while households making $15,000 to $30,000 would need about $24,000. While residual-income burdens are less common among higher-income households making at least $75,000, those who are burdened would need an additional $14,000 on average to meet their non-housing expenses.
We also examined various policy interventions that would bring down the cost of housing, transportation, healthcare, and food to see how reduced expenses would decrease the incidence or severity of residual-income cost burdens. For lower-income households making less than $30,000, a combined affordable housing and transportation subsidy would close the gap the most, reducing the average income deficit by half (Table 1). For middle-and higher-income households, providing universal childcare would reduce the amount households fall short. However, each of these interventions would only marginally reduce the number of residual-income burdened renters.
Table 1: Effect of Policy Interventions on Residual-Income Cost Burdens
| Average Income Deficit (Dollars) for Households with Residual-Income Cost Burdens | ||||||||||||
|---|---|---|---|---|---|---|---|---|---|---|---|---|
| Existing | With Policy Intervention | |||||||||||
| Affordable Housing | Affordable Housing and Transportation | Half Healthcare Subsidy | Half Food Subsidy | Full Childcare | ||||||||
| Less than $15,000 | 34,000 | 26,600 | 16,900 | 30,600 | 31,200 | 30,800 | ||||||
| $15,000–29,999 | 24,200 | 19,500 | 12,900 | 20,500 | 20,900 | 20,100 | ||||||
| $30,000–44,999 | 18,300 | 15,900 | 14,300 | 16,000 | 15,800 | 13,600 | ||||||
| $45,000–74,999 | 17,800 | 17,200 | 16,800 | 16,300 | 15,100 | 11,400 | ||||||
| $75,000 or more | 14,000 | 13,500 | 13,200 | 12,500 | 11,800 | 8,000 | ||||||
| All working-age renter households | 24,500 | 20,400 | 15,000 | 22,100 | 22,100 | 20,600 | ||||||
Sources: Author tabulations of US Census Bureau, 2018 American Community Survey 1-year estimates; and Economic Policy Institute, Family Budget Calculator.
Ultimately, layered subsidies for affordable housing and transportation, childcare, food, and healthcare would all move households toward a comfortable standard of living, but income supports may also be needed for lower-income households. The Earned Income Tax Credit has been an important resource for decades before the pandemic. The pandemic further reinforced the importance of cash assistance as economic impact payments and temporarily expanded child tax credits helped buoy many households. Raising the minimum wage or offering a universal basic income could also help more families reach a basic but comfortable standard of living.


