The Insurance Crisis Continues to Weigh on Homeowners

Insurance has grabbed headlines lately for good reason. As home prices remain elevated at historically high levels, rising insurance premiums are also contributing to the growing costs of homeownership and property management. From the Great Recession to the present, homeowners insurance prices have increased 74 percent while home prices have increased more than 40 percent, even after adjusting for inflation. Real premiums have risen approximately 20 percent between 2020–2023 alone (Figure 1). Premiums are increasing for both homeowners insurance (which typically covers common risks including fire) and for hazard-specific insurance (separate policies for more localized risks like earthquakes, floods, and other climate-related exposures).
Figure 1: Rising Home Prices and Homeowners Insurance Costs Are Dual Affordability Stressors
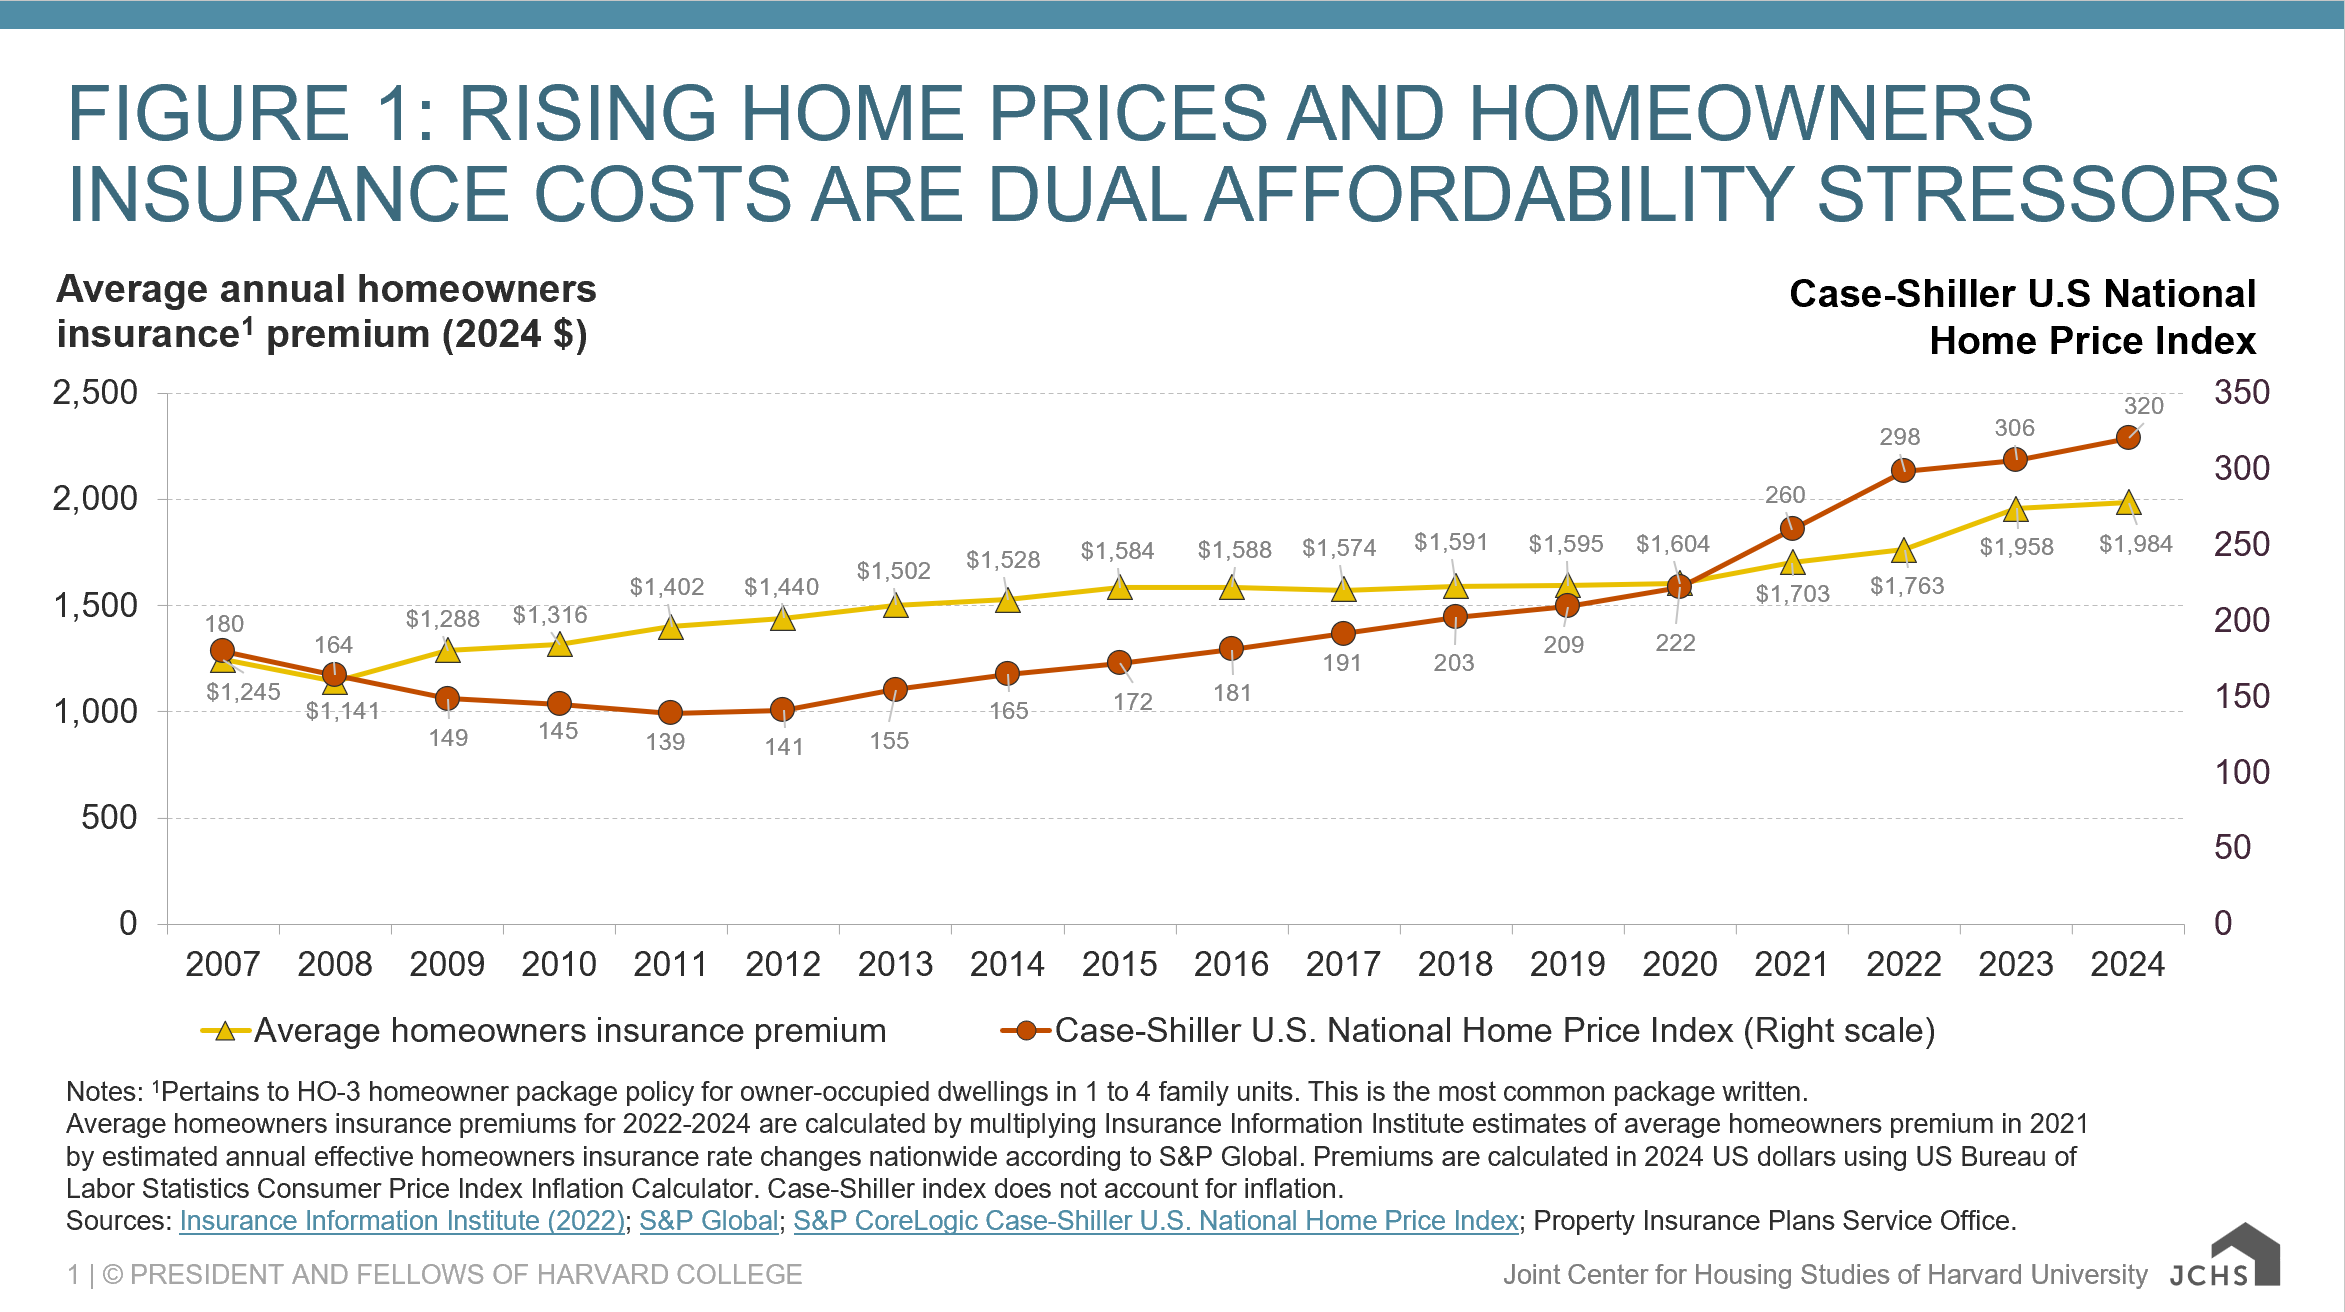
Notes: 1Pertains to HO-3 homeowner package policy for owner-occupied dwellings in 1 to 4 family units. This is the most common package written.
Average homeowners insurance premiums for 2022–2024 are calculated by multiplying Insurance Information Institute estimates of average homeowners premium in 2021 by estimated annual effective homeowners insurance rate changes nationwide according to S&P Global. Premiums are calculated in 2024 US dollars using US Bureau of Labor Statistics Consumer Price Index Inflation Calculator. Case-Shiller index does not account for inflation.
Sources: Insurance Information Institute (2022); S&P Global; S&P CoreLogic Case-Shiller U.S. National Home Price Index; Property Insurance Plans Service Office.
Home, rental, and property-related insurance products are ubiquitous and foundational to the health of the US housing market. Insurance functions like a glue that helps the housing finance system stick together. For example, access to homeowners insurance and mortgage insurance facilitates a prospective homebuyer’s access to mortgage credit. After a disaster, a homeowners insurance claim payout can smooth the financial shock from covered damages and help the homeowner rebuild. In short, insurance helps make homeownership possible and preserves hard-earned home equity when hazards strike.
Given its important role in housing markets and the broader economy, property insurance underwriting has evolved to become a highly regulated industry. However, unlike the housing finance system that is largely regulated at the federal level, property and casualty (P&C) insurance has been regulated by states since the McCarran-Ferguson Act of 1945. As a result, a diverse constellation of regulatory contexts and rate-setting approaches has emerged. It is common for states to regulate insurers’ premiums in granular detail, and for tensions to arise in the process. Income and racial disparities in insurance pricing and coverage have largely diminished over the last half-century, though some financial markers such as credit scores can still be considered in pricing. Additionally, the increase in hazard exposures—many due to climate change—are positively associated with much of the recent premium growth.
With increasing costs, there is a growing home equity protection gap. In 2022, an estimated 12 percent of homeowners did not have homeowners insurance. This occurs at the same time the share of homeowners without a mortgage and associated lender insurance requirements remains above 40 percent. These figures do not take into account the sizable share of renters who lack renters insurance coverage for their homes’ contents.
Most households buy their coverage from the private insurance market for homeowners insurance, though their insurers may also bundle in public hazard insurance policies such as that of the National Flood Insurance Program (NFIP). As a result of market conditions, private insurers have faced unprofitability, insolvencies, and/or exited markets altogether in states like California, Louisiana, and Florida. Some industry analysts question whether the homeowners line of business is profitable at all, following years of underwriting losses and rising replacement costs. Within states, there is considerable variation across insurers’ pricing, leading many consumers to shop around. Risk-based pricing reflects expected damages from covered perils, but often leads to unaffordable premiums. Alternatively, underpricing policies relative to true risks can enable risk-seeking behavior such as further development in highly exposed regions. What happens when homeowner affordability and housing viability do not align?
More than two-thirds of states have created Fair Access to Insurance Requirements (FAIR) plans to function as insurers of last resort. Figure 2 shows the relative changes in the number of residential policies written by the five largest state FAIR plans, as well as aggregate FAIR plan exposures across all states. The total amount of asset value insured by state FAIR plans has eclipsed one trillion dollars, and the number of residential policies in the two largest state programs (Florida and California) has more than doubled since 2018.
Figure 2: A Growing Number of Residential Policies are Moving into Residual Markets
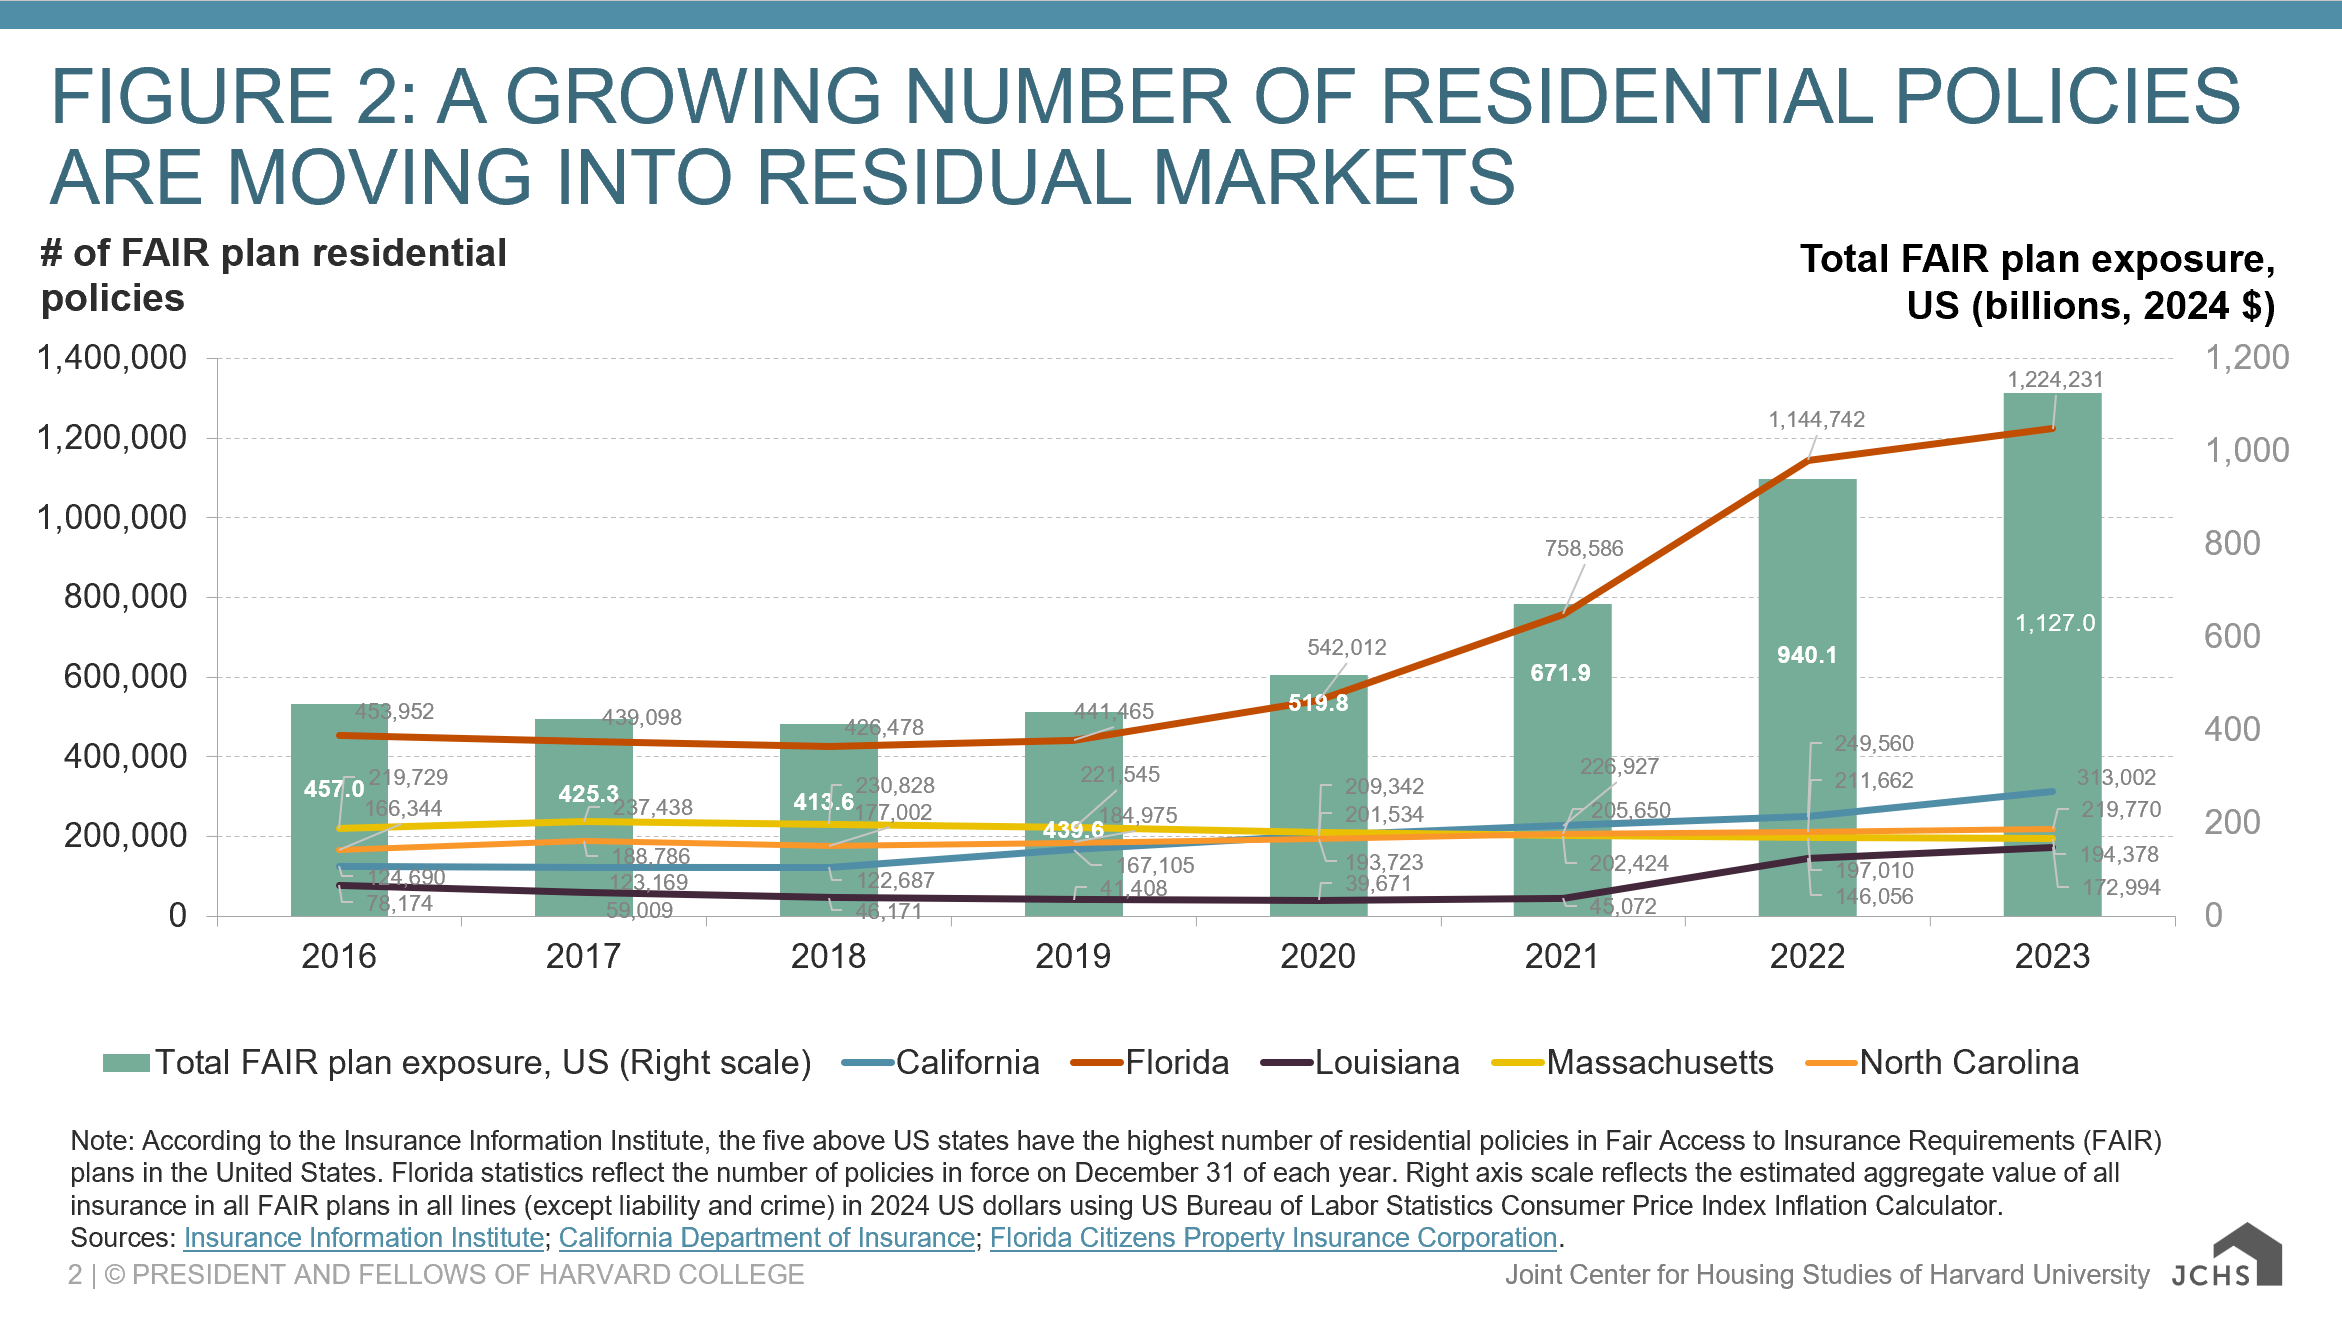
Note: According to the Insurance Information Institute, the five above US states have the highest number of residential policies in Fair Access to Insurance Requirements (FAIR) plans in the United States. Florida statistics reflect the number of policies in force on December 31 of each year. Right axis scale reflects the estimated aggregate value of all insurance in all FAIR plans in all lines (except liability and crime) in 2024 US dollars using US Bureau of Labor Statistics Consumer Price Index Inflation Calculator.
Sources: Insurance Information Institute; California Department of Insurance; Florida Citizens Property Insurance Corporation.
While the governance and financial structures of FAIR plans vary, they generally benefit from state-derived authority to levy assessments on firms and policyholders to fund claims in the event of insolvencies. These FAIR plans are often referred to as the residual market, and Florida’s Citizens Property Insurance Corporation is the largest in terms of both the number of residential policies and asset value insured. While state authorities generally want to depopulate these programs in order to limit the financial exposure of their constituencies, the residual market has continued to grow in recent years, which is an indicator of private insurance market health and systemic public financial risk. The California Department of Insurance recently approved Allstate’s request to raise the firm’s average homeowners insurance premiums in the state by 34 percent, underscoring that private firms’ market participation is contingent on financial returns. In some states, relatively financially-precarious “non-admitted” insurance providers are also entering the market, raising concerns about solvency and consumer financial protection.
Today, homes located in Federal Emergency Management Agency (FEMA)-defined regulatory floodplains are required to purchase a flood-specific insurance policy (separate from a homeowners insurance policy) in order to access a federally-backed mortgage. The NFIP was established in 1968 to address limited coverage availability in the private market and functions like a large federal residual market for flood insurance. Recent estimates indicate the majority of flood insurance policies are still written through the NFIP, though there has been recent growth in the private market. The number of residential policies written by the NFIP, however, has declined from 5.4 million in 2009 to 4.5 million in 2023, with accompanying decreases in coverage (Figure 3).
Figure 3: National Flood Insurance Program (NFIP) Residential Coverage is Declining
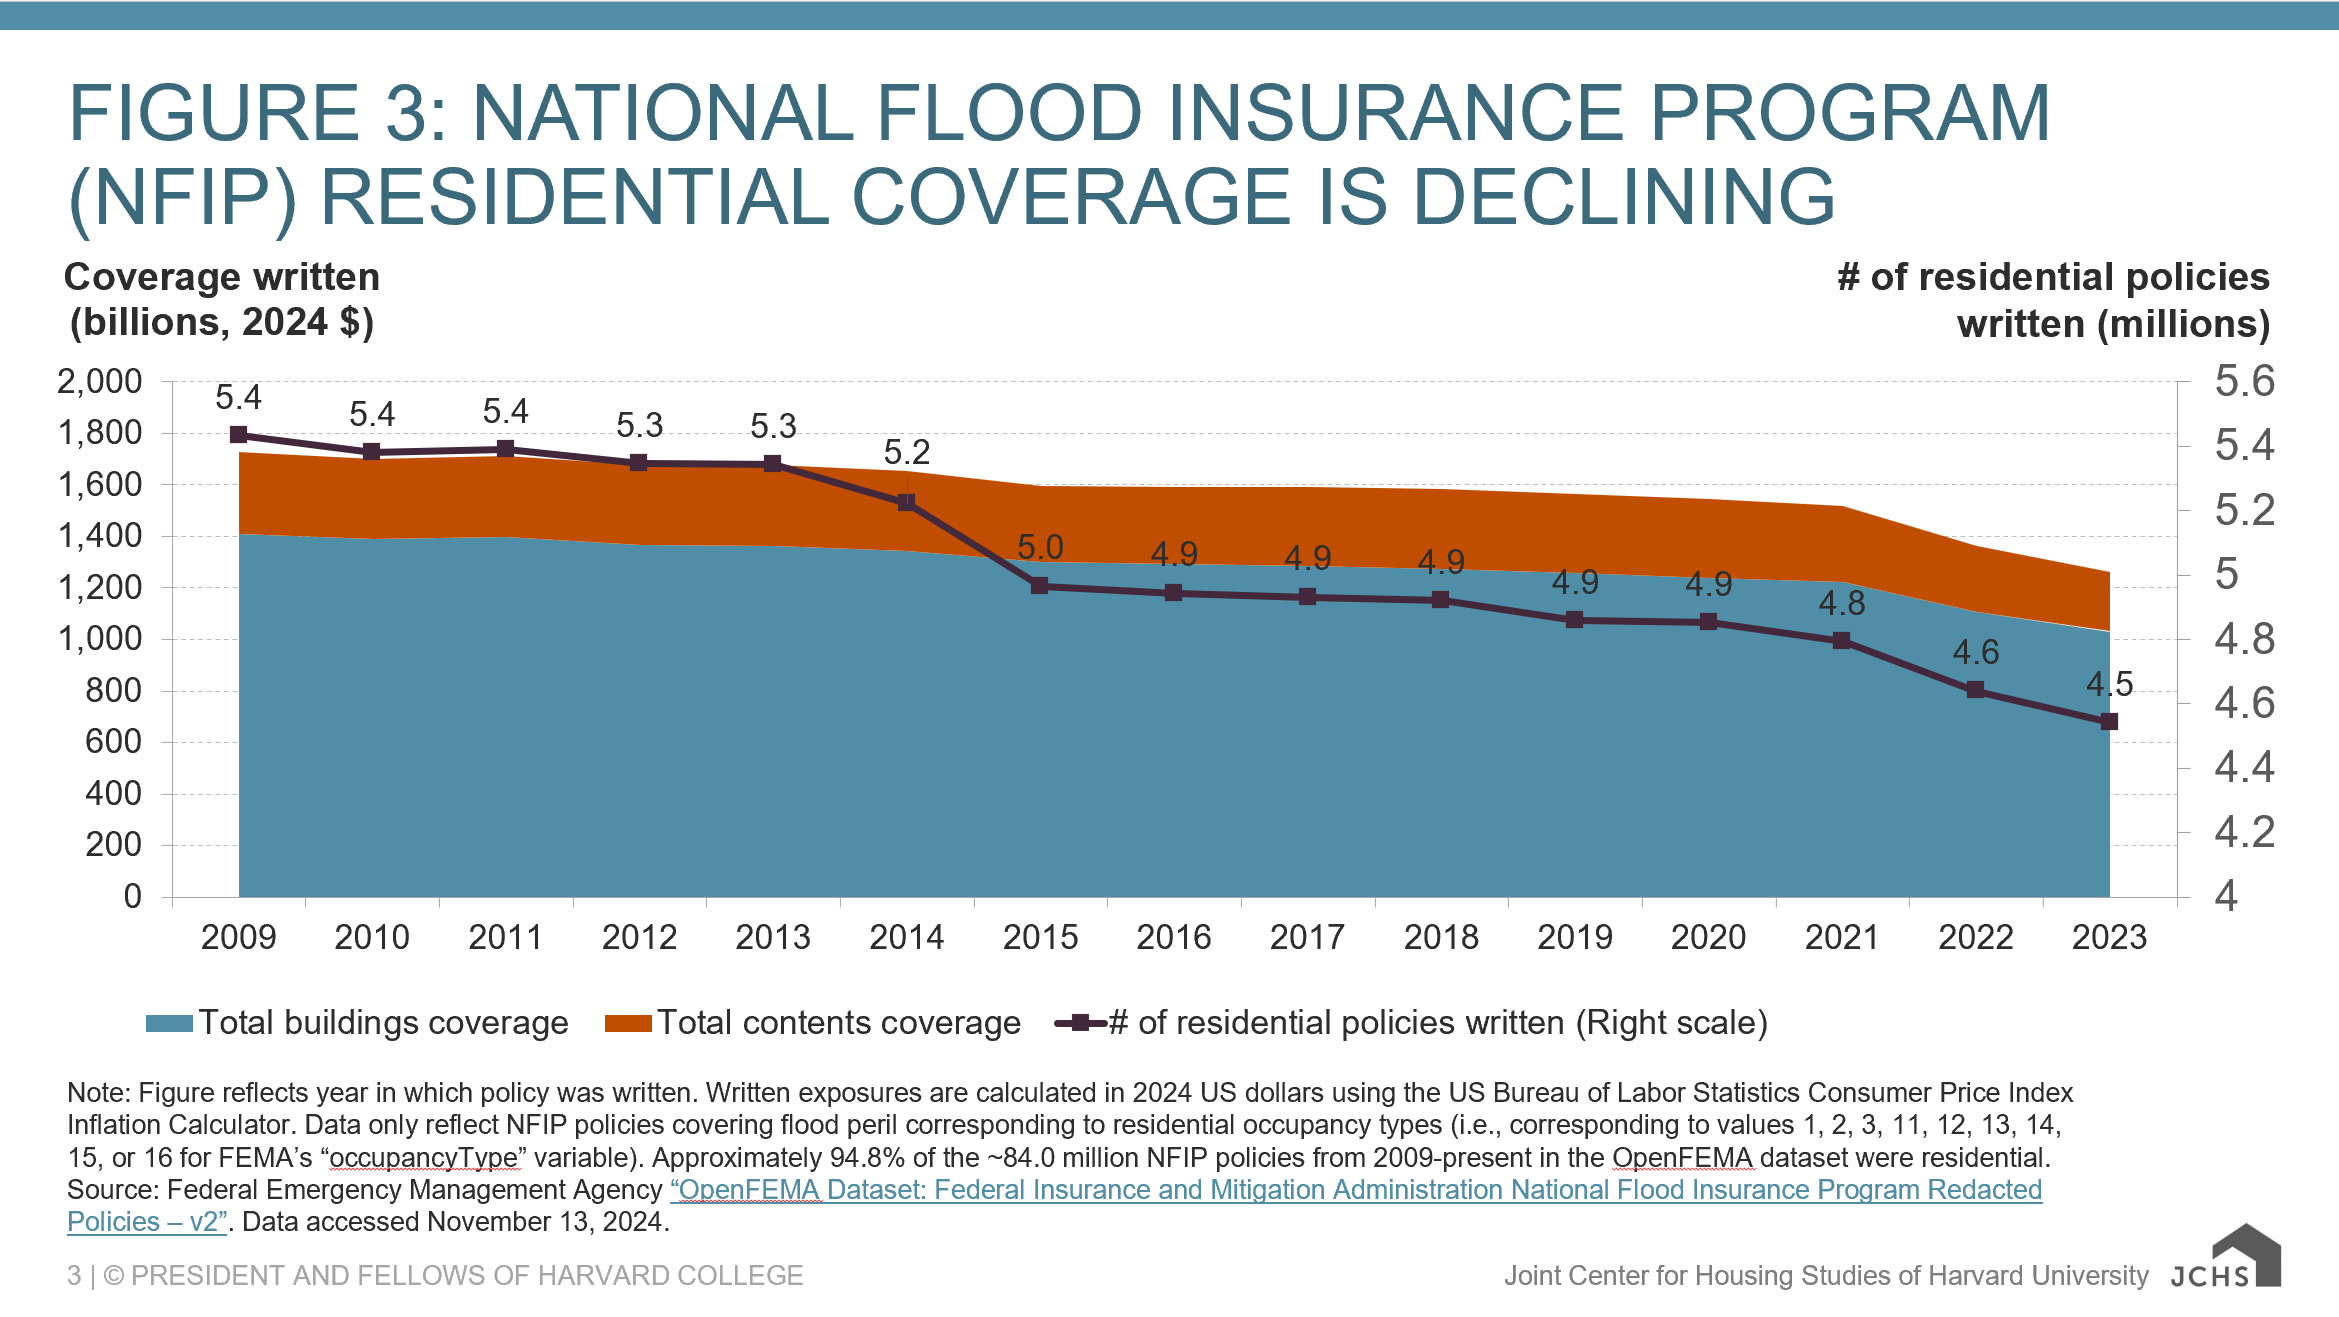
Note: Figure reflects year in which policy was written. Written exposures are calculated in 2024 US dollars using the US Bureau of Labor Statistics Consumer Price Index Inflation Calculator. Data only reflect NFIP policies covering flood peril corresponding to residential occupancy types (i.e., corresponding to values 1, 2, 3, 11, 12, 13, 14, 15, or 16 for FEMA’s “occupancyType” variable). Approximately 94.8% of the ~84.0 million NFIP policies from 2009-present in the OpenFEMA dataset were residential.
Source: Federal Emergency Management Agency “OpenFEMA Dataset: Federal Insurance and Mitigation Administration National Flood Insurance Program Redacted Policies – v2”. Data accessed November 13, 2024.
Similar to homeowners insurance markets, the NFIP has the difficult task of balancing affordability and actuarial soundness. Low uptake among homeowners in flood-prone areas, including limited compliance with mandatory NFIP purchase requirements, highlights a flood-specific aspect of the homeowner protection gap. At the programmatic level, NFIP insolvency has been averted through Congressional action allowing NFIP to take on additional debt from the US Treasury and tens of billions of dollars of NFIP debt has been cancelled. For uninsured households, disaster loans and disaster assistance may be available in the wake of a major flood disaster, however disaster assistance payment amounts are capped and have also been found to crowd out future purchase of insurance.
Innovative developments in the insurance field, including technological advancements, non-profit partnerships, new parametric products, and user-friendly tools from FEMA, are providing reason for optimism. However, property insurance is not a panacea and does not directly mitigate nor avoid physical damage. Protective infrastructure along with home mitigation improvements like fireproofing landscapes and home elevations will be needed to buy time. Mortgage and lending practices, as well as local land use regulations that incentivize vulnerable development in exposed areas, must also change. Ultimately, as the costs from climate change-fueled hazards and other covered perils continue to mount, insurance will be a key mechanism for strengthening household financial resilience for some time.


