Housing Cost Burdens Climb to Record Levels (Again) in 2023

Housing affordability worsened again last year, as a record number of US households were cost burdened. According to our tabulations of the newly released 2023 American Community Survey data, an all-time high 42.9 million households were cost burdened, meaning they spent more than 30 percent of their income on housing costs. Annually, an additional 850,000 households had burdens, continuing a trend of rapidly deteriorating affordability since the start of the pandemic. Additionally, 21.5 million households were severely cost burdened, devoting more than 50 percent of their income to housing, marking another all-time high.
The majority of the rise in burdened households was driven by an increasing number of cost-burdened homeowners. Indeed, homeowner burdens increased by 650,000 households in 2023, pushing the number of homeowner households with burdens up by 3.6 million since 2019 to 20.3 million overall (Figure 1). Fully 24 percent of homeowners were burdened by housing costs. While the number of burdened homeowners is still far below the record 22.9 million seen during the Great Recession, last year’s increase indicates a worrying trend. Homeowner cost burdens have risen rapidly as a growing number of older adult households retire or scale back at work—reducing their incomes—and as ongoing housing costs rise. Median monthly costs for homeowners increased 6 percent in 2023 to $1,327. Overall costs for homeowners have risen 18 percent since 2019. Meanwhile, payments for homeowners without a mortgage—driven by rising insurance costs and property taxes—have increased an even more striking 28 percent since before the pandemic. At the same time, median homeowner incomes have risen 16 percent.
Figure 1: The Number of Cost-Burdened Households Reached Another Record High in 2023
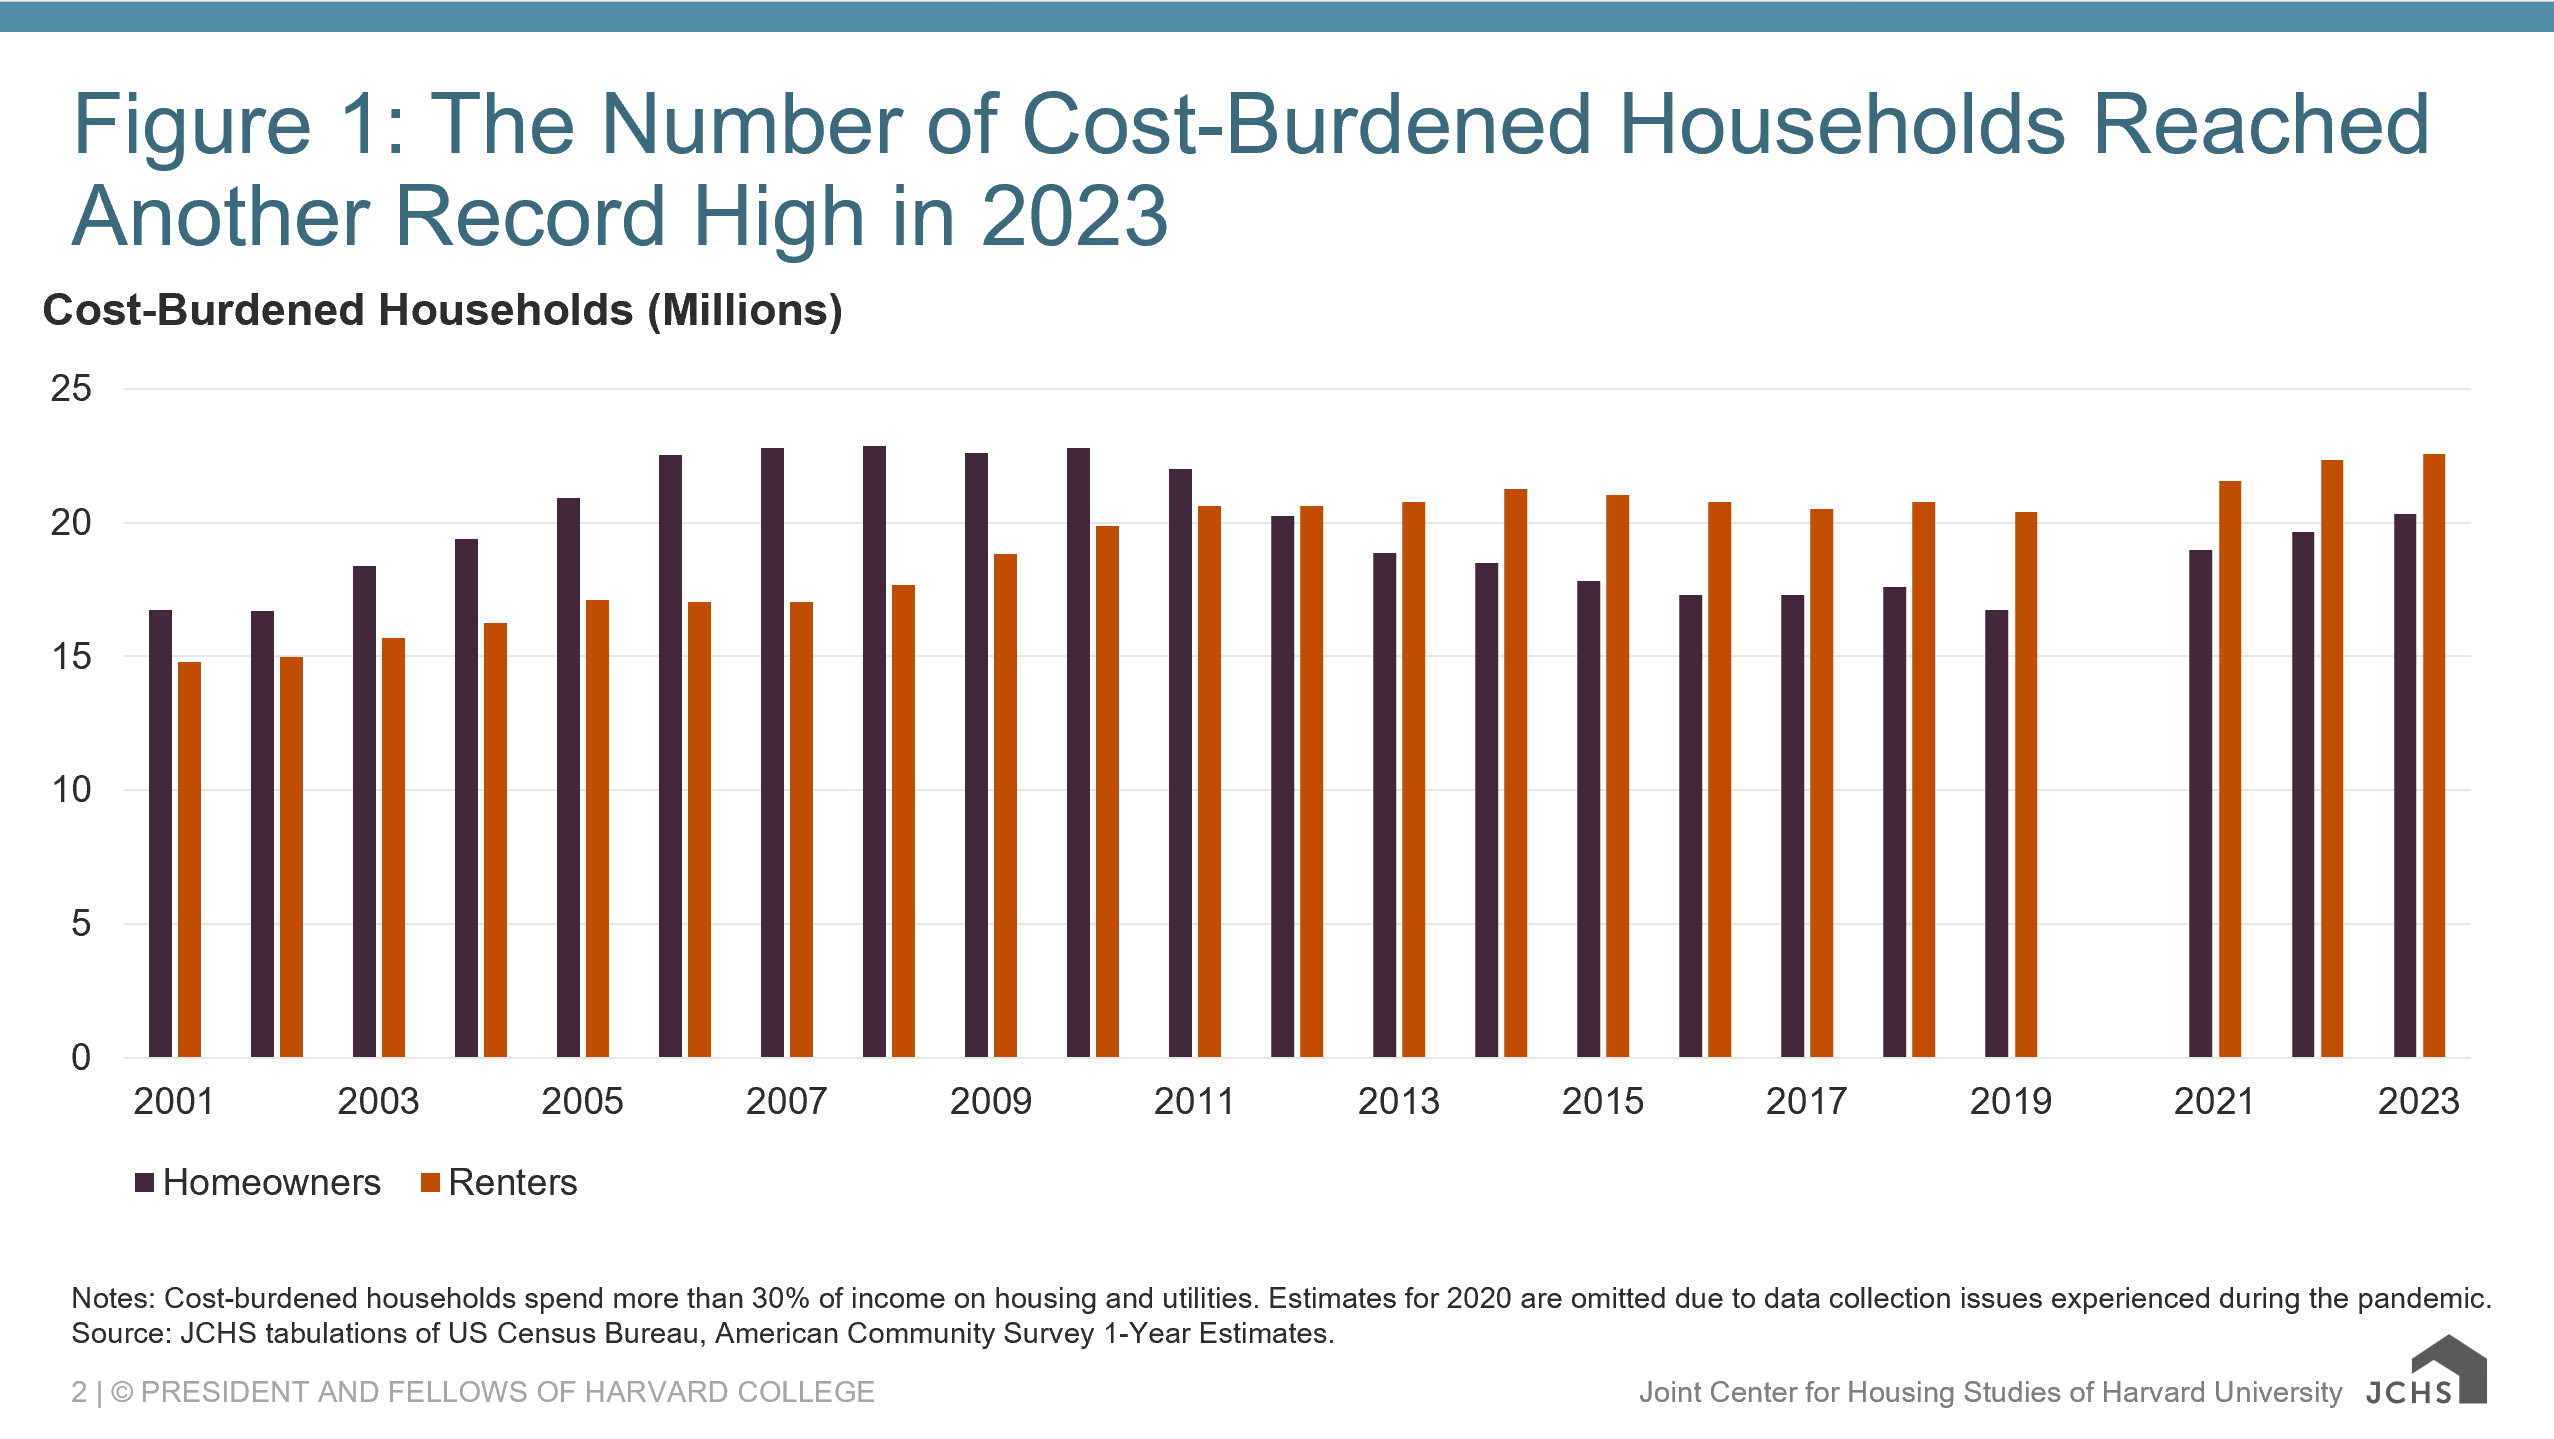
Notes: Cost-burdened households spend more than 30% of income on housing and utilities. Estimates for 2020 are omitted due to data collection issues experienced during the pandemic.
Source: JCHS tabulations of US Census Bureau, American Community Survey 1-Year Estimates.
The number of renter households with cost burdens also increased, setting another all-time high. Fully 22.6 million renter households were cost burdened in 2023, an increase of 200,000 year over year and up 2.2 million since 2019. Renters generally have greater affordability challenges and were more than twice as likely to be cost burdened as homeowners (50 percent of all renter households). Renter incomes have likewise not kept pace with the dramatic rise in rents. The median income for renter households rose 19 percent between 2019 and 2023, while rents rose 29 percent to $1,403, an 8 percent increase over the past year.
Cost burdens continued to rise most among lowest-income homeowners. The share of homeowners with income under $30,000 that were cost burdened grew to a record-high 74 percent in 2023, a 1.4 percentage point jump from 2022 and up 5.4 percentage points since 2019 (Figure 2). Monthly housing costs for lower-income owners have risen a whopping 26 percent since 2019, compared to 10-to-13 percent for all other owners. Consequently, cost burdens have risen but more modestly for homeowners with household incomes above $30,000.
Figure 2: Cost Burdens Have Risen Especially Rapidly for Lower-Income Homeowners and Middle-Income Renters
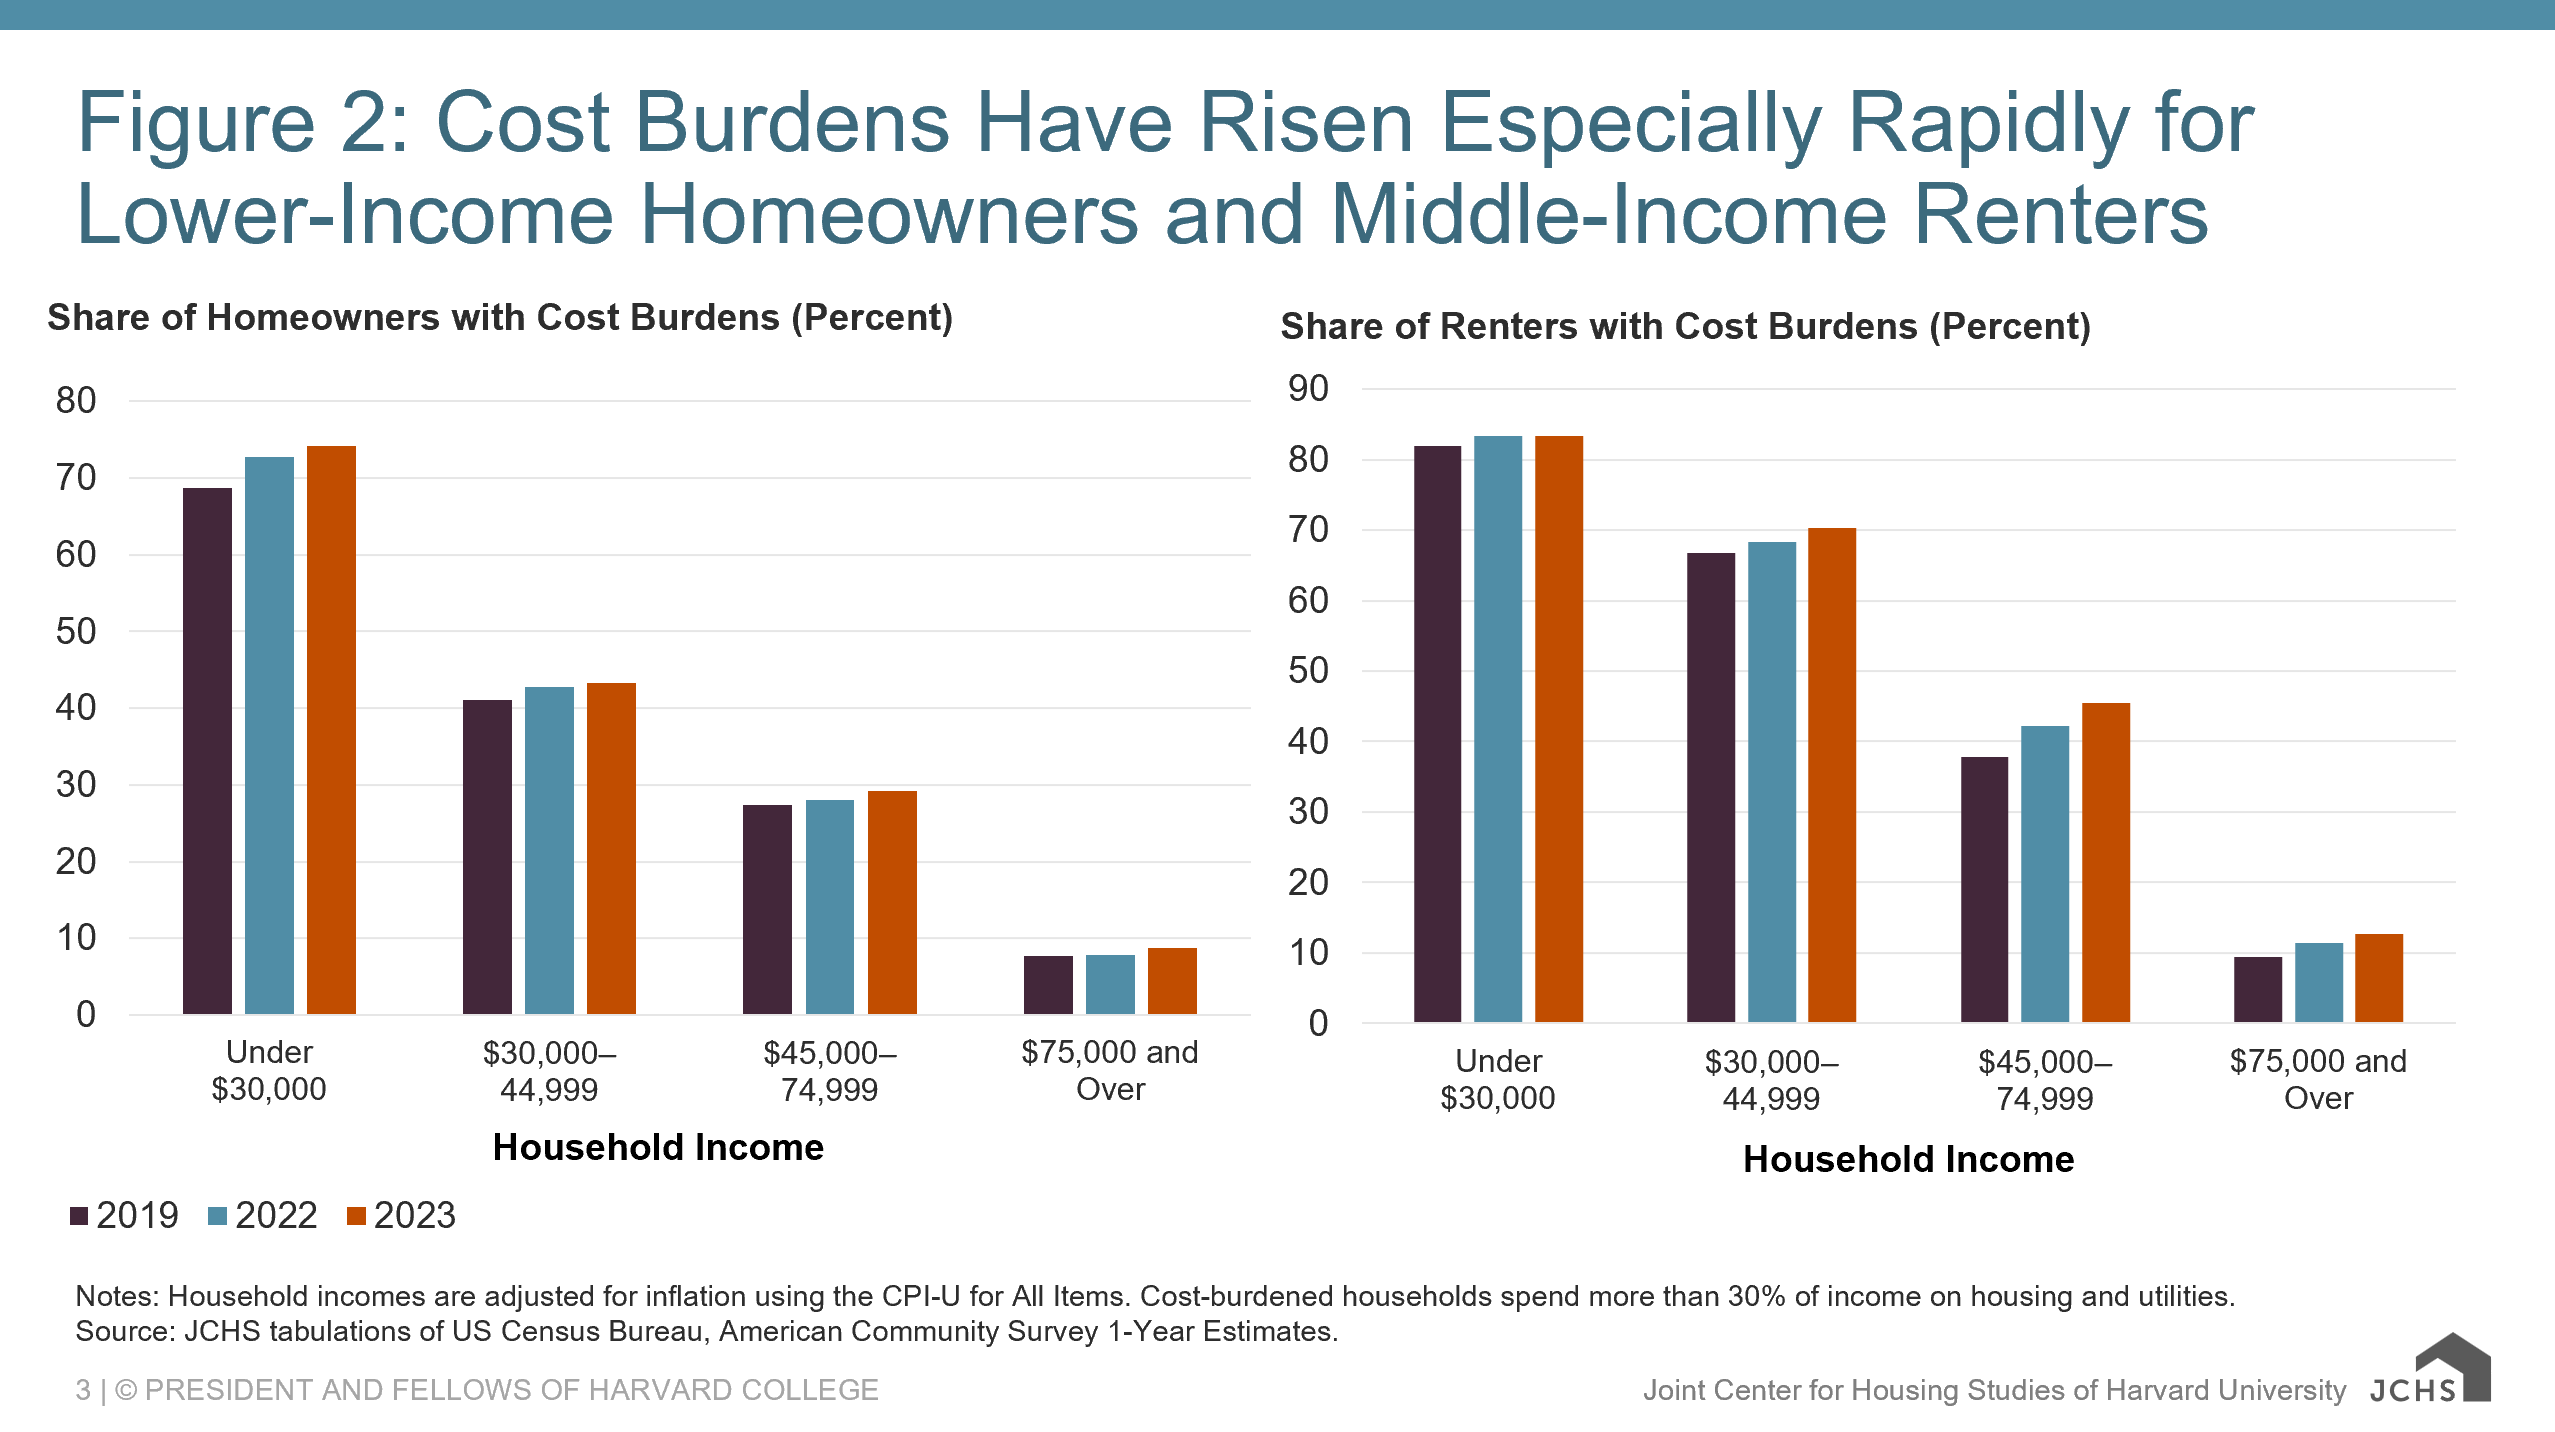
Notes: Household incomes are adjusted for inflation using the CPI-U for All Items. Cost-burdened households spend more than 30% of income on housing and utilities.
Source: JCHS tabulations of US Census Bureau, American Community Survey 1-Year Estimates.
Affordability challenges have grown most rapidly for middle-income renters. Indeed, 70 percent of renters earning $30,000–44,999 had cost burdens in 2023, an increase of 1.9 percentage points in one year and 3.5 percentage points since 2019. Cost burdens among households earning $45,000–74,999 increased an even more striking 3.3 percentage points in just one year to 45 percent, up 7.7 percentage points from before the pandemic. However, cost burdens for lower-income renters remain most severe and these affordability challenges continue to worsen. An astounding 83 percent of renters earning under $30,000 were cost burdened in 2023.
Whether they own or rent, people of color generally face greater affordability challenges than white households. Among homeowners, households of color were cost burdened at higher rates than their white counterparts (Figure 3). Nearly one-third of Black, 29 percent of Hispanic, 26 percent of Asian, 25 percent of multiracial, and 24 percent of Native American homeowner households were burdened in 2023, compared to just 22 percent of white homeowners. Among renter households, more than half of Black (57 percent), Hispanic (53 percent), and multiracial (50 percent) renters had cost burdens. However, a still-substantial 46 percent of white, 45 percent of Asian, and 43 percent of Native American renters were burdened.
Figure 3: Households of Color Generally Face Greater Affordability Challenges than White Households
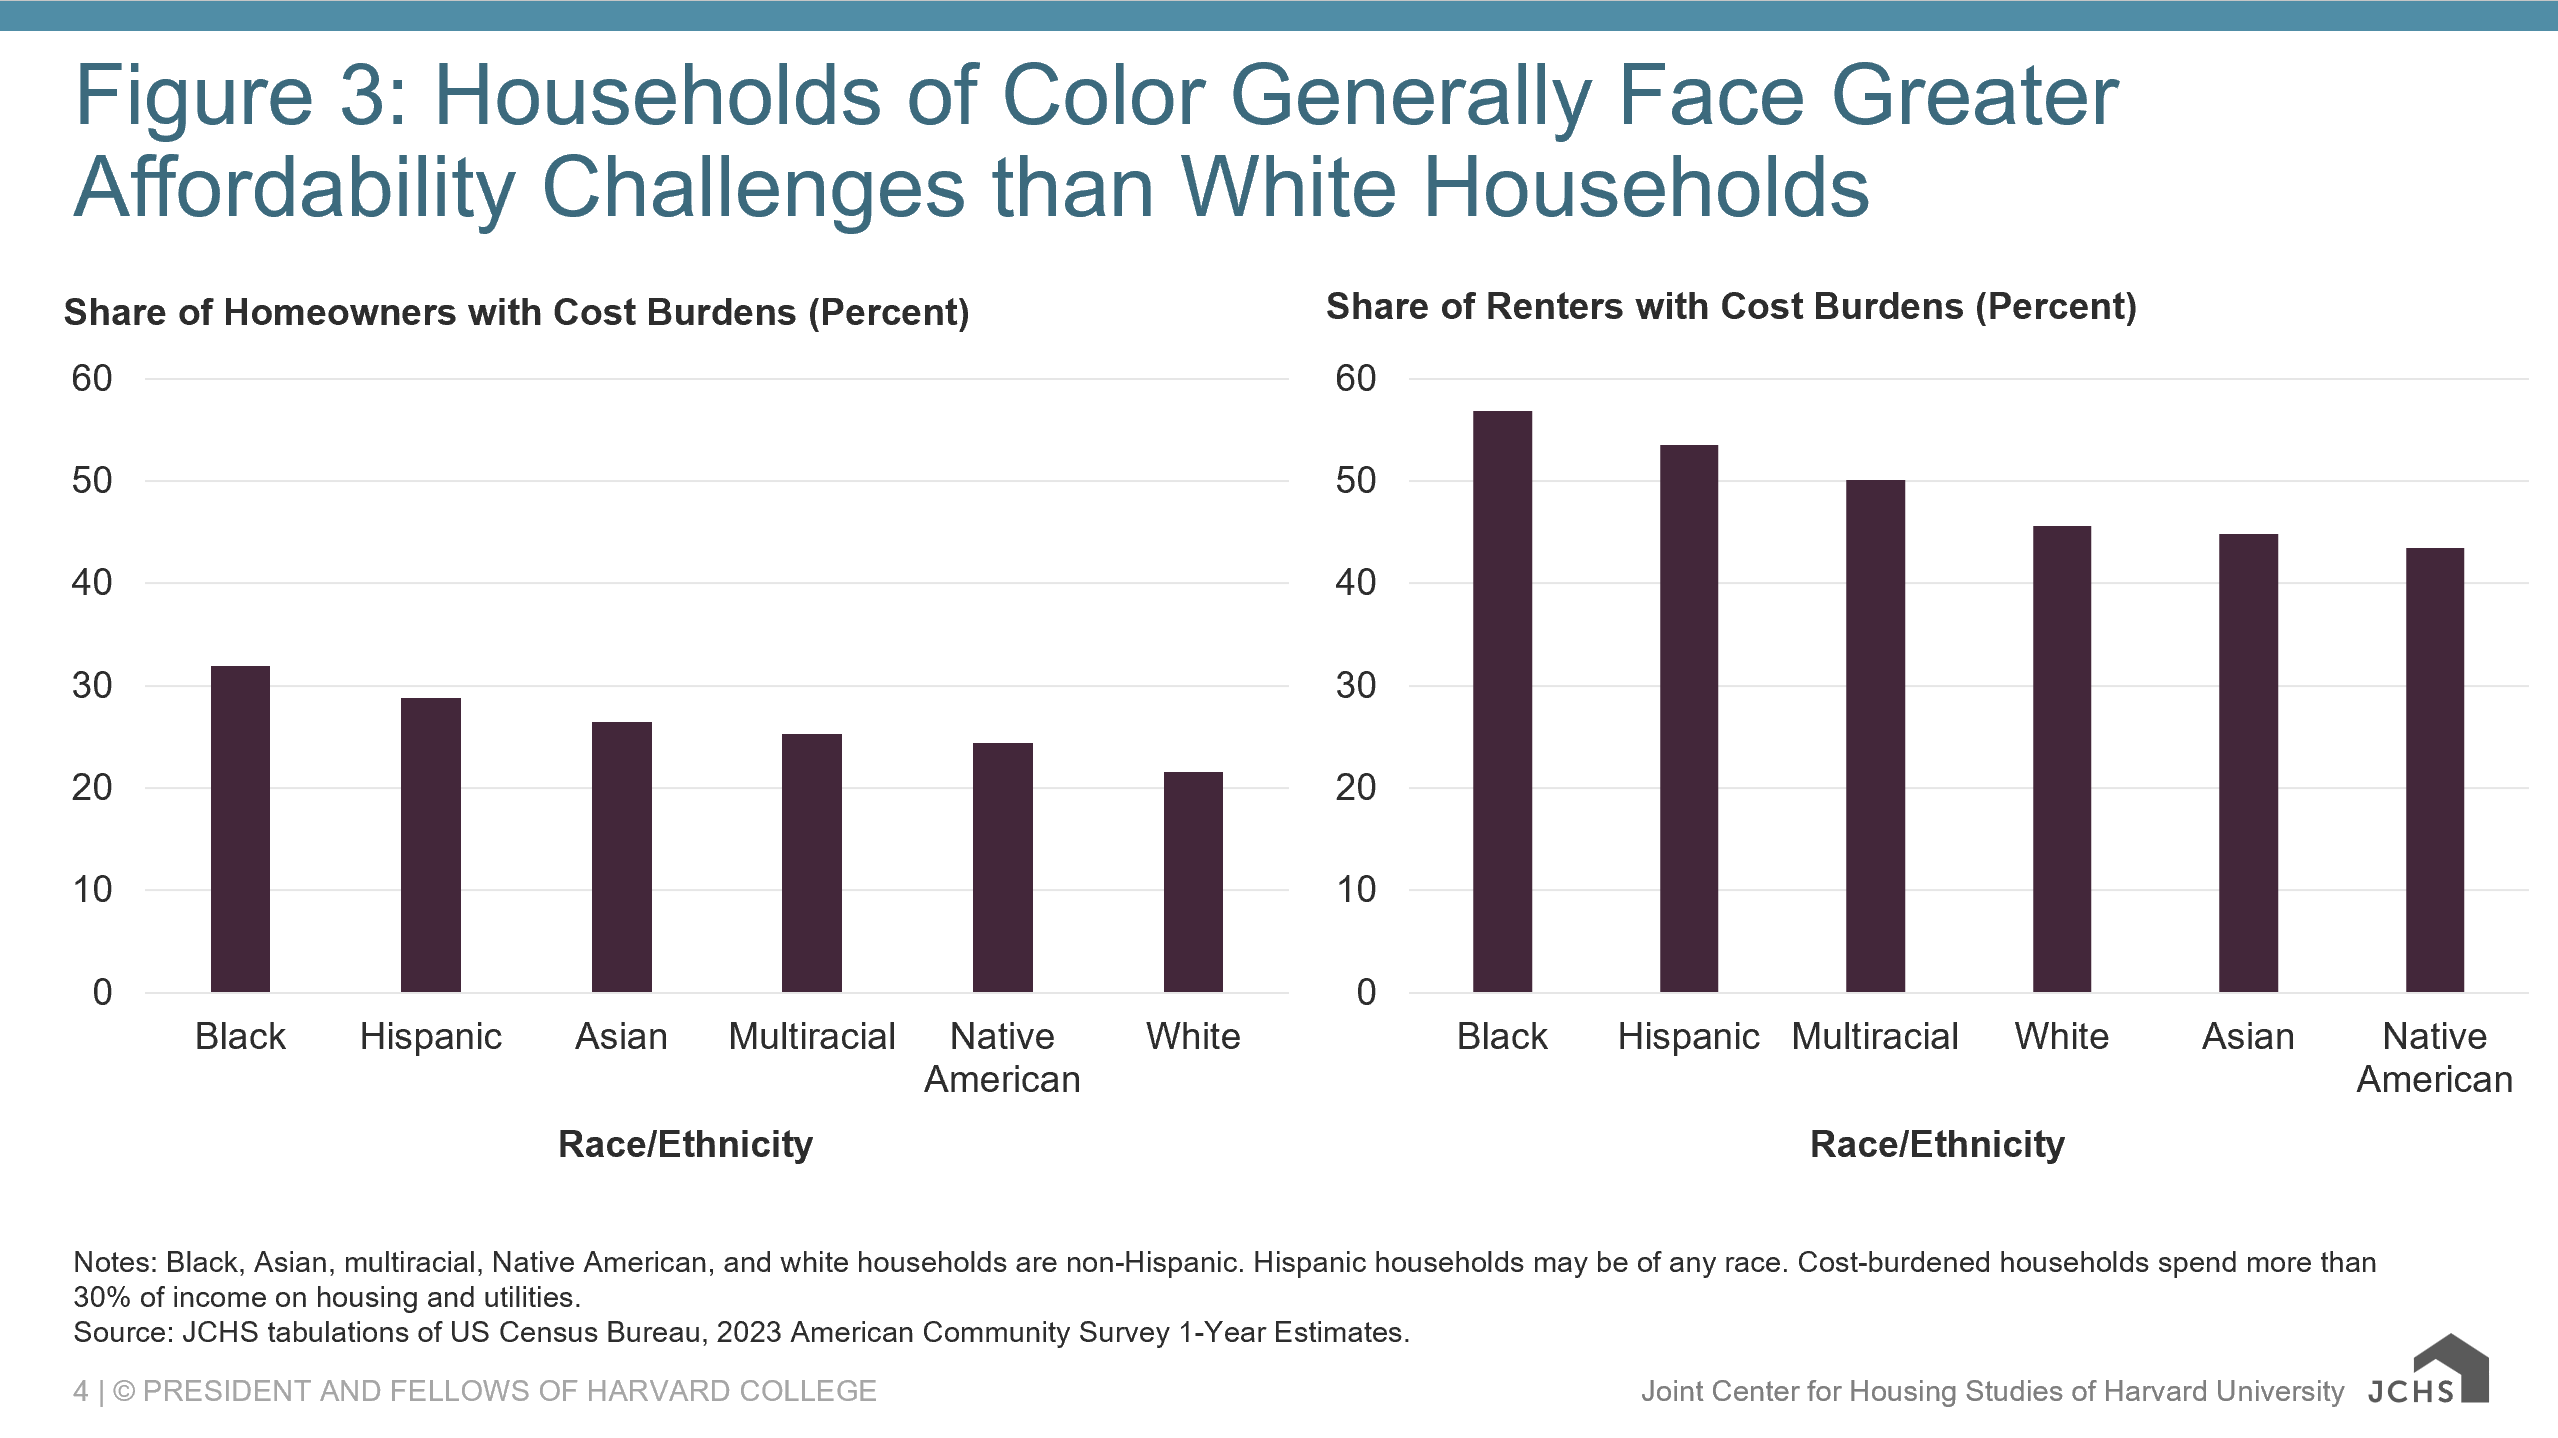
Notes: Black, Asian, multiracial, Native American, and white households are non-Hispanic. Hispanic households may be of any race. Cost-burdened households spend more than 30% of income on housing and utilities.
Source: JCHS tabulations of US Census Bureau, 2023 American Community Survey 1-Year Estimates.
These unprecedented affordability challenges are driven by the rapid rise in housing costs in the aftermath of the pandemic, outpacing income growth and pushing even more households into unaffordable living arrangements. In the coming weeks, the Center will publish additional research examining the persistent affordability challenges of the nation’s households.


