Housing and Livable Neighborhoods

What role does housing play in creating livable neighborhoods that help residents of all ages, incomes, and abilities to thrive? That question was a key part of our recent report, co-authored with colleagues at AARP’s Public Policy Institute, in which we explored the nature of the nation’s most livable communities as measured by AARP’s Livability Index. We found that the most livable neighborhoods offer the most diverse set of housing options, including multifamily and rental opportunities as well as single-family and owner-occupied homes. Yet housing also tends to be more expensive in the most livable places, which could pose a barrier to lower- and middle-income households.
AARP’s Livability Index is an online resource that provides livability scores for neighborhoods across the US by measuring seven key areas: housing, neighborhood features, transportation, environment, health, engagement, and opportunity. The Index generates scores for each category, which are averaged to produce an overall livability score. The housing measure looks at a variety of metrics, including the median share of income spent on housing, the presence of subsidized housing, the share of units in multifamily buildings, and the share of units with zero-step entrances.
In our analysis, we produced overall scores for the nation’s nearly 218,000 census block groups and then divided these into quintiles. In general, the housing sub-score was the least correlated with the overall livability score, but mean scores for housing were highest in the quintile of neighborhoods with the highest overall livability scores.
We then examined the housing characteristics of each quintile with data from the American Community Survey. We found that the places with the highest overall livability scores offer the greatest array of housing options. As one moves up the livability spectrum, the share of multifamily units increases, as does the share of apartments in larger buildings. While only 10 percent of housing in the lowest livability quintile is in multifamily buildings, this share rises to 44 percent in the most livable neighborhoods, where there is also a greater mix of building types. High livability neighborhoods also have the highest share of renter-occupied housing at 44 percent, compared to 23 percent in the lowest-livability locations.
Yet the most livable neighborhoods also had the highest median rents and the highest median housing values. For owner-occupied housing, the median value ranged from $176,000 in the lowest livability quintile to $323,000 in the highest; while for rental housing, the median monthly rent range rose from $920 in the lowest quintile to $1160 in the highest (Figure 1). The share of lower cost rental units falls as one moves up the livability spectrum: while 47 percent of rentals in the lowest livability quintile rent for less than $800 per month, the share falls to less than 30 percent in the highest quintile.
Figure 1: Median Rents and Housing Prices Rise Across Livability Quintiles
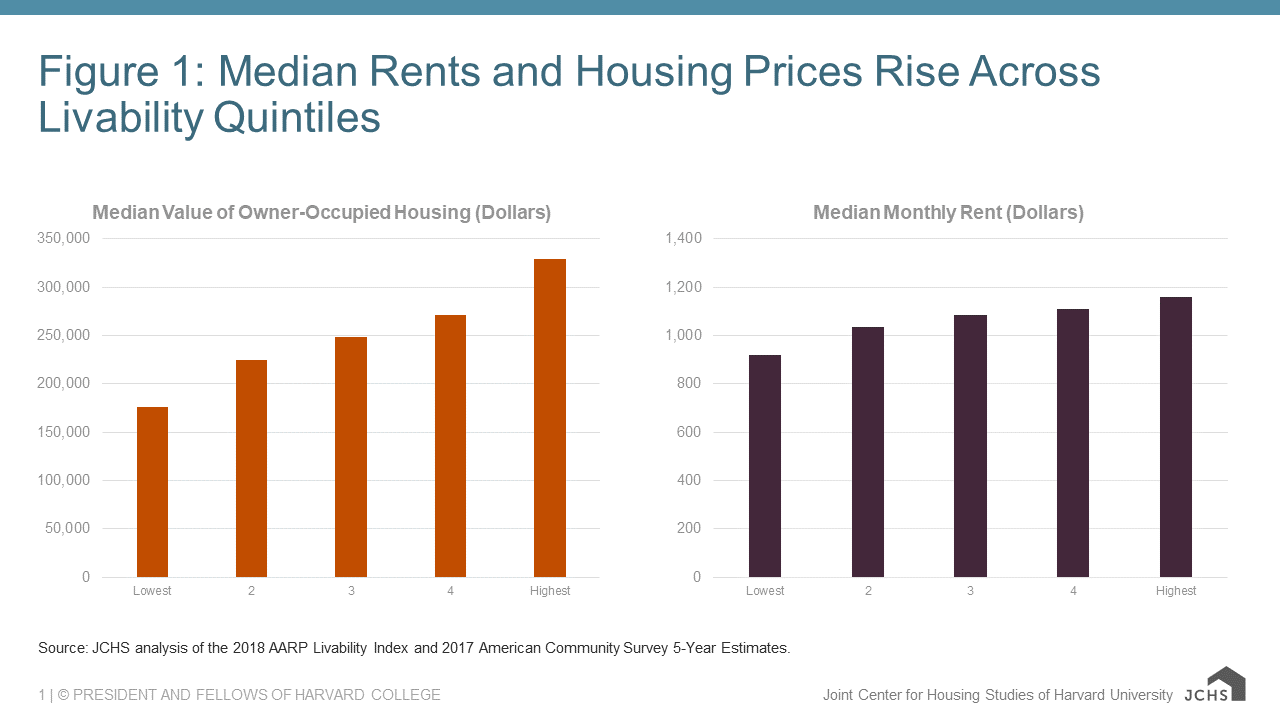
Source: JCHS analysis of the 2018 AARP Livability Index and 2017 American Community Survey 5-Year Estimates.
Unsurprisingly, median incomes are higher in the places with the highest overall scores in the Index. Median income rises from a low of $55,250 in the lowest livability quintile to a peak of $66,200 in the fourth quintile, falling just slightly to $65,800 in the highest livability places. And in another part of our analysis, we found that older movers are more likely to relocate to places that are more livable than their last neighborhood if they have higher income, reinforcing the idea that the most livable places are more accessible to those with the ability to pay higher housing costs.
Also not surprising, low-income older adults—those earning less than $30,000 per year—are overrepresented in neighborhoods with the lowest median housing prices and incomes. Yet our research also showed that despite higher housing costs, these households are also slightly overrepresented in neighborhoods receiving the highest overall livability scores. This somewhat unexpected finding has a few possible explanations. Lower-income households are more likely to rent their homes, and there are more rental options in the most livable communities (including those with lower rents) some of which likely include subsidized housing options. But it is also the case that lower-income older adults in highly livable neighborhoods may be unaffordably housed, as evidenced by the higher cost burden rates in these places (Figure 2). While our cost burden analysis did not disaggregate households, we know from previous analysis that lower-income renters are the most likely of all income/tenure groups to face cost burdens.
Figure 2: Older Adults Are More Likely to Face Cost Burdens in High Livability Neighborhoods
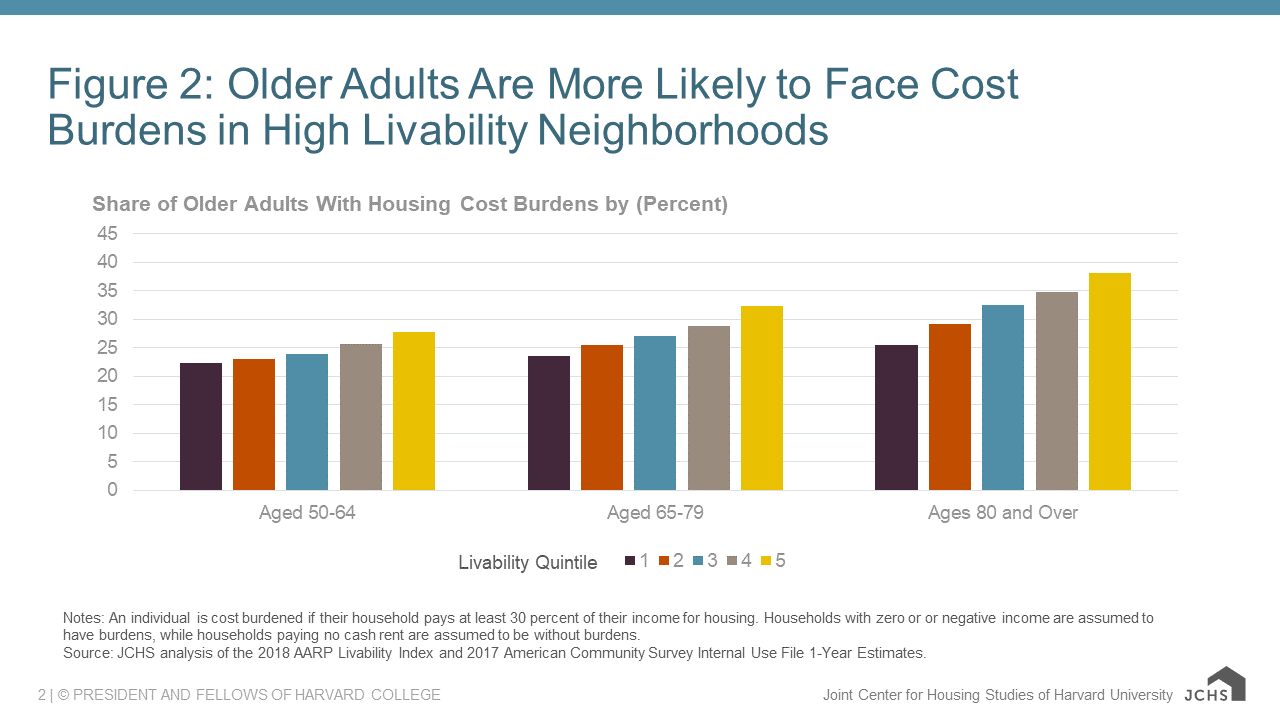
Notes: An individual is cost burdened if their household pays at least 30 percent of their income for housing. Households with zero or or negative income are assumed to have burdens, while households paying no cash rent are assumed to be without burdens.
Source: JCHS analysis of the 2018 AARP Livability Index and 2017 American Community Survey Internal Use File 1-Year Estimates.
There are a number of policy implications that emerge from the analysis. Improving housing affordability in the most livable communities is critical to ensuring these places are truly open to people of all incomes. While neighborhoods that score highest on the livability spectrum tend to have the most housing types, expanding access to these locations means expanding income-restricted options, such as homes developed through Low Income Housing Tax Credits, Section 202 housing for older adults, inclusionary housing policies, and other federal, state, and local affordable housing programs. Greater rental assistance to low-income older adults can help as well.
Also important are policies and programs that help ensure older adults can remain in their homes even when housing costs increase. For owners, this might take the form of programs supporting home repairs and property tax abatements. For all households, assistance with utility bills may help. And for renters, increased tenant protections and rental assistance are needed.
Yet places with lower livability scores have housing needs as well. While housing costs may be lower in these locations, incomes are also lower and cost burden rates are significant. Income-restricted units and rental assistance can help in these communities. So too can increasing the range of housing options, including accessory dwelling units suited to small households and more rental and multifamily housing (particularly located near transit or town centers).
And across all levels of livability, there is need for more accessible housing to meet the needs of the growing number of older adults with mobility difficulties. Low-cost loan and grant programs can help older adults modify their homes to accommodate changing physical needs, while visitability policies can encourage accessibility in new housing going forward.
Together, improving housing affordability, accessibility, and choice can help build more livable communities, helping more people live in the places they prefer—affordably, securely, and safely housed.


