Behind the Data: Dramatic Changes in Low-Growth Cities and States

Whenever the Census Bureau releases its annual population estimates, the press release and the coverage that follows invariably single out the fastest growing places. In doing so, the Bureau and the press seem to suggest that high-growth areas are interesting because they are demographically dynamic. Meanwhile, low-growth areas merit little attention, apparently because “low growth” must mean that not much is really changing in those places.
However, even in slow-growing places the population could be changing in dramatic ways. Low population growth could occur, for example, in places where many residents move to another state but the out-migration is offset by inflows of domestic and international migrants. Moreover, if the immigrants and domestic out-migrants in slow-growing places are both young, the “natural increase” in population – the difference between births and deaths – may be higher for minorities and lower for non-Hispanic whites.
A closer look at the data on changes in slow-growing places shows that this is exactly what is happening in many places. Twelve of the 20 states with the highest rates of net domestic out-migration in 2017-18 also had the highest rates of international migration. In seven of these states, domestic migration losses exceeded international migration gains, and in five states the opposite was true. However, in all cases the losses and gains lead to significant population turnover (Table 1).
Table 1. States with the 20 Lowest Rates of Domestic Out-Migration and the 20 Highest Rates of Immigration
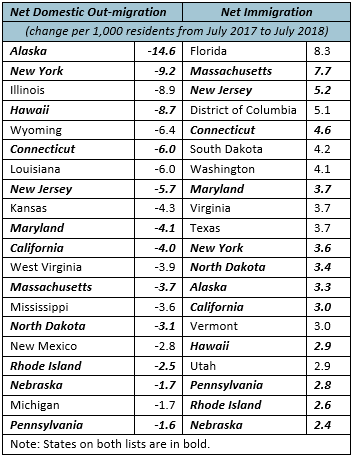
Source: Census Bureau 2018 state population estimates Table 6
While the Census Bureau’s detailed estimates on the age, race, and ethnicity of the population in 2018 will not be released until later this year, Census data showing changes between 2010 and 2017 also show notable racial and ethnic change in virtually every state. This was especially true in the slow-growing states discussed above. Notably, the data show that while the minority population increased in every state, the non-Hispanic white population fell in 24 states. These declines were especially large in California, Illinois, New Jersey, New York, and Pennsylvania (Figure 1).
Figure 1. State Population Growth 2010-2017 by Minority Status

Source: Census Bureau annual estimates of state population by race and Hispanic origin
Growth in the minority population more than offset the decline in the non-Hispanic white population in 20 of the 24 states where the latter declined (the exceptions were Connecticut, Vermont, West Virginia, and Illinois). Aside from California, total net population growth in states with declining non-Hispanic white populations was not especially large. However, the relatively modest increase in population in the other states masked the fact that these states saw a substantial turnover in their population. In fact, New York, New Jersey, Pennsylvania, Illinois, Massachusetts, Maryland, Michigan, and Ohio were all in the top 10 for turnover by race and ethnicity between 2010 and 2017.
Many of the same population turnover dynamics are evident when the focus shifts from states to metropolitan areas. As with states, the Metropolitan Statistical Areas (MSAs) with the highest rates of growth from international in-migration also had net domestic out-migration between 2010 and 2018. The exceptions to this trend included Orlando, Naples, and Houston, which attracted both foreign and domestic migrants, as well as Iowa City and College Station, which are college towns that also attracted both foreign and domestic migrants (Figure 2).
Figure 2. Many of the Top 25 Metros with Highest Average Rates of Growth from International In-Migration between 2010 and 2017 Also Have High Rates of Domestic Out-Migration

Source: Joint Center for Housing Studies calculations based on Census Bureau population estimates of metropolitan areas
Taken as a whole, these data show that even in seemingly slow-growing places, there can be (and usually are) substantial changes in the race, ethnicity, and nationality of current residents, a finding that could have important implications for local housing markets and policies.


