Benchmark Update Significantly Boosts Remodeling Market Size Projections
By Abbe Will
January 19, 2023
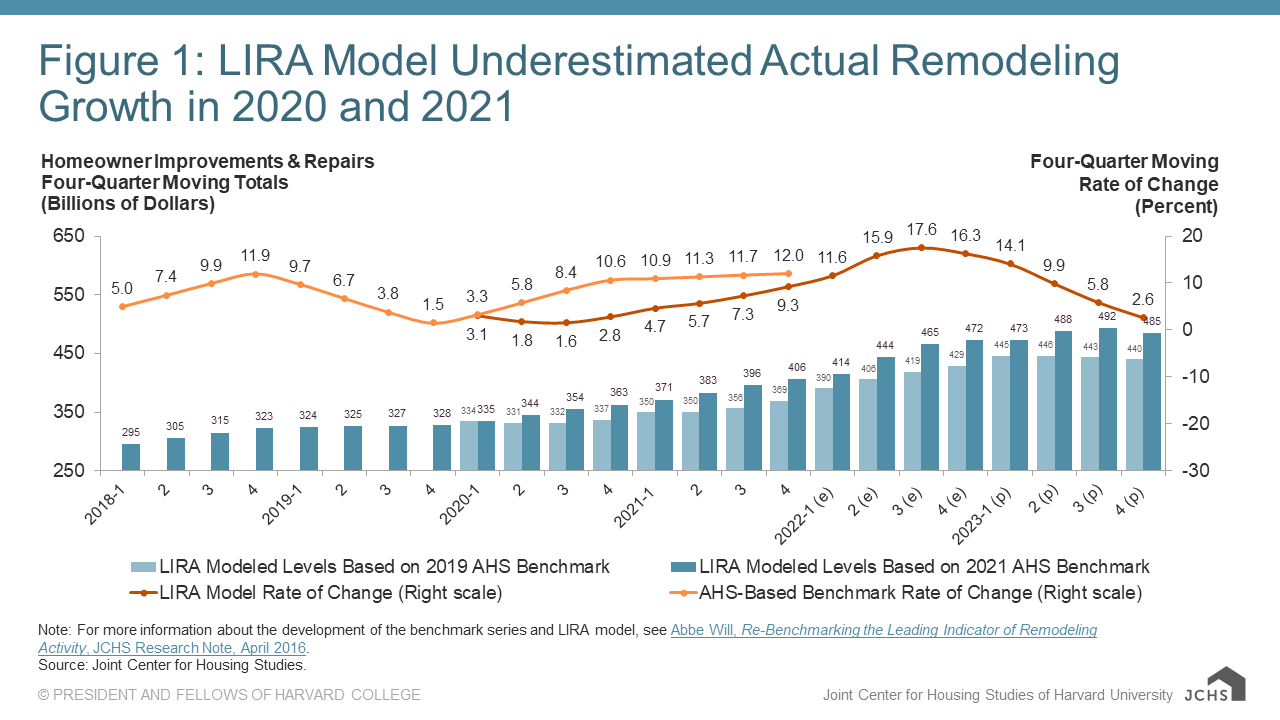
The Center’s Leading Indicator of Remodeling Activity (LIRA) provides a short-term outlook of national home improvement and repair spending to owner-occupied homes and is benchmarked to national spending estimates from the US Department of Housing and Urban Development’s American Housing Survey (AHS). The latest LIRA release projects national spending for remodeling and repairs to owner-occupied homes will grow to $485 billion in 2023, an increase of 2.6 percent from last year. This LIRA release also updates and revises historical spending levels and growth due to the incorporation of new benchmark data from the recently released 2021 AHS.
Compared with last quarter’s LIRA release, the updated LIRA now shows considerably higher market size estimates and projections for remodeling and repair activity in 2020, 2021, 2022, and 2023. According to Center estimates based on tabulations of the latest AHS, spending growth in 2020 and 2021 was more robust than the LIRA model estimated, though the difference between estimated and actual growth rates closed substantially by the end of 2021 as seen in Figure 1. Over this two-year period of remarkable pandemic-induced changes in housing and lifestyle decisions, the homeowner remodeling and repair market expanded fully 24 percent from $328 billion in 2019 to $406 billion in 2021 compared with LIRA estimated growth of 12 percent. The much stronger growth in benchmark remodeling and repair spending from 2019 to 2021 has implications for the size of the market previously modeled by the LIRA model for 2020, 2021, and 2022, as well as LIRA projections for 2023.
(Click charts to enlarge.)
Note: For more information about the development of the benchmark series and LIRA model, see Abbe Will, Re-Benchmarking the Leading Indicator of Remodeling Activity, JCHS Research Note, April 2016.
Previously, the LIRA projected a homeowner improvement and repair market size of $429 billion in 2022 with spending growing to $440 billion in 2023. Now with the replacement of AHS-based benchmark data for previously modeled estimates, the LIRA model indicates remodeling activity reached $472 billion in 2022 and projects spending will reach $485 billion this year. The implication of significantly stronger growth in actual remodeling and repair spending from 2019 to 2021 is an expansion in market size estimates for 2022 of 10.2 percent or $43.8 billion, and a similar expansion in market size projections for 2023 of 10.2 percent or $44.9 billion.
The weighted average of the LIRA model inputs produces the LIRA estimates and projections as seen in Figure 2A (for modeling improvement spending trends) and Figure 2B (for modeling maintenance and repair spending trends) compared with the now updated AHS-based benchmark data series for 1994–2021. Overall, the improvements LIRA tracks the reference series very closely, but is less volatile. The estimates produced by the improvements LIRA model and the AHS-based benchmark now have a correlation coefficient of 0.81 (p-value of 0.00), barely budging from the 0.82 correlation coefficient before adding in the updated benchmark data for 2020 and 2021. And a simple regression of the LIRA output on the benchmark spending series results in an R-squared value of 0.6562, which suggests that 66 percent of the variation, or movement, in the improvements spending benchmark can be explained by the LIRA model. These values are also largely unchanged from the last time the benchmark series was updated two years ago.
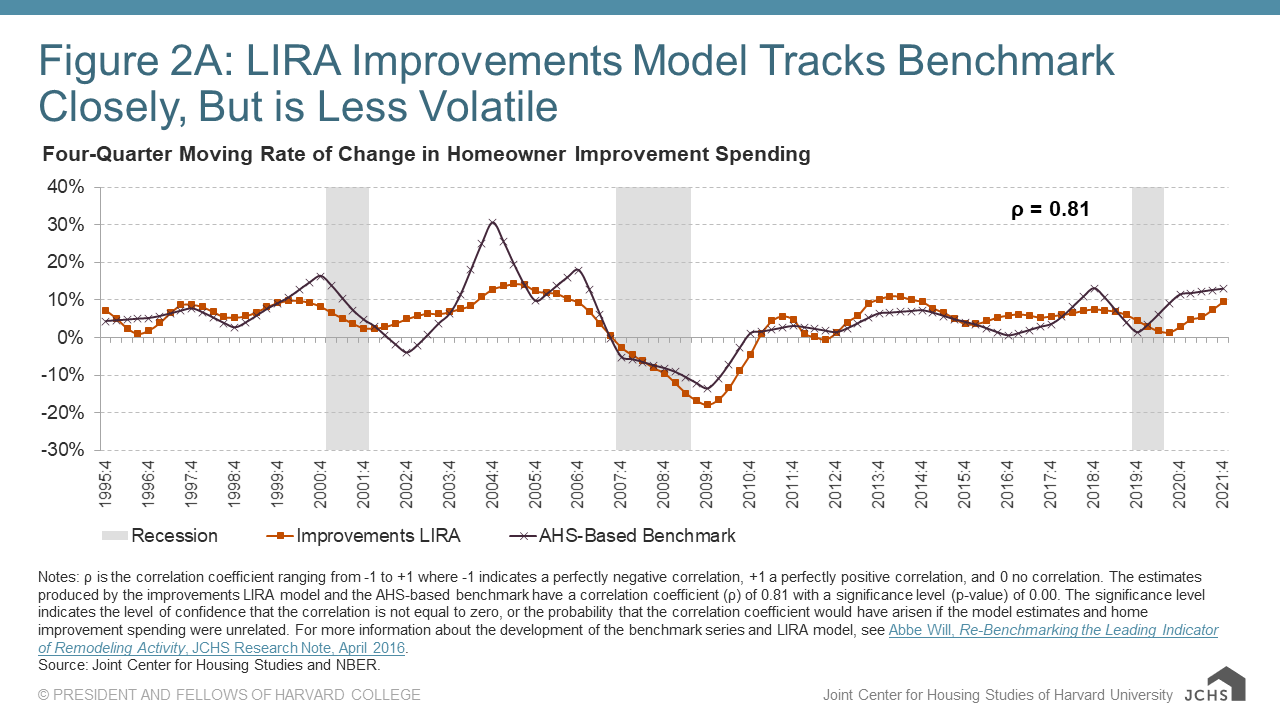
Notes: ρ is the correlation coefficient ranging from -1 to +1 where -1 indicates a perfectly negative correlation, +1 a perfectly positive correlation, and 0 no correlation. The estimates produced by the improvements LIRA model and the AHS-based benchmark have a correlation coefficient (ρ) of 0.81 with a significance level (p-value) of 0.00. The significance level indicates the level of confidence that the correlation is not equal to zero, or the probability that the correlation coefficient would have arisen if the model estimates and home improvement spending were unrelated. For more information about the development of the benchmark series and LIRA model, see Abbe Will, Re-Benchmarking the Leading Indicator of Remodeling Activity, JCHS Research Note, April 2016.
Source: Joint Center for Housing Studies and NBER.
Similarly, Figure 2B compares the weighted average output of the maintenance and repair LIRA model with its AHS-based reference series. The maintenance LIRA has also tracked its benchmark fairly well historically and more so after recovering from the prior remodeling market downturn in 2008. The maintenance and repair LIRA and its reference series have a correlation coefficient of 0.68 (p-value of 0.00) and a simple regression of the LIRA output on the benchmark results in an R-squared value of 0.4569, which suggests that about 46 percent of the movement in the home maintenance and repair spending benchmark can be explained by this LIRA model.
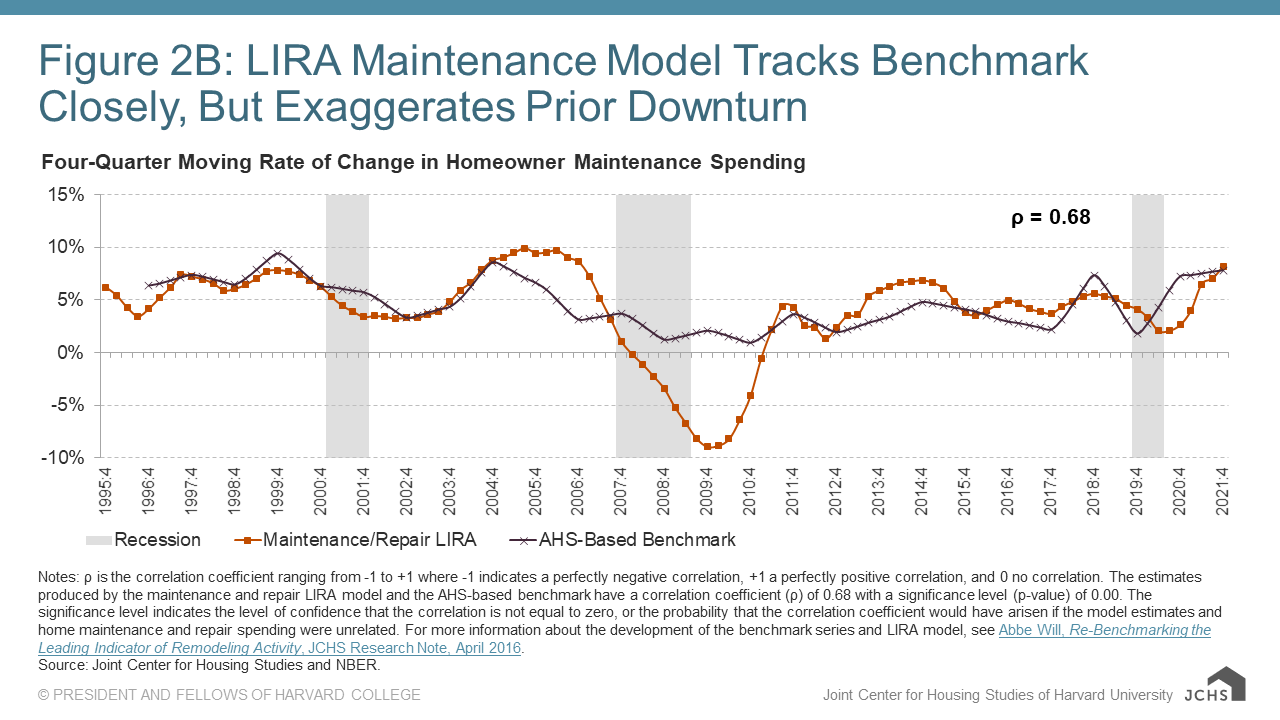
Notes: ρ is the correlation coefficient ranging from -1 to +1 where -1 indicates a perfectly negative correlation, +1 a perfectly positive correlation, and 0 no correlation. The estimates produced by the maintenance and repair LIRA model and the AHS-based benchmark have a correlation coefficient (ρ) of 0.68 with a significance level (p-value) of 0.00. The significance level indicates the level of confidence that the correlation is not equal to zero, or the probability that the correlation coefficient would have arisen if the model estimates and home maintenance and repair spending were unrelated. For more information about the development of the benchmark series and LIRA model, see Abbe Will, Re-Benchmarking the Leading Indicator of Remodeling Activity, JCHS Research Note, April 2016.
Source: Joint Center for Housing Studies and NBER.
In 2016, the LIRA was re-benchmarked to a measure of home improvement and repair spending based on estimates from HUD’s biennial American Housing Survey. Once every two years, with new historical AHS data, the LIRA benchmark series will also be updated. Beginning with the January 2023 release, the LIRA model will be used to estimate historical spending levels since 2021 until the next biennial release of the American Housing Survey allows for actual 2022 and 2023 spending data to replace modeled estimates.
Our Mission
The Harvard Joint Center for Housing Studies strives to improve equitable access to decent, affordable homes in thriving communities. We conduct rigorous research to advance policy and practice, and we bring together diverse stakeholders to spark new ideas for addressing housing challenges. Through teaching and fellowships, we mentor and inspire the next generation of housing leaders.

