Pre-Pandemic Trends Offer Insight into Post-Pandemic Homelessness
While there is not yet national data on homelessness during the pandemic, recently released data show that the number of people experiencing homelessness in the United States rose from 568,000 in January 2019 to 580,000 in January 2020. Given that many people have lost income and been unable to keep up with housing payments during the pandemic, the most recent Point-in-Time (PIT) Estimates of Homelessness released this month by the US Department of Housing and Urban Development (HUD) suggest that homelessness will continue to be a significant challenge that will need to be addressed as the nation recovers from COVID-19. In particular, my analysis of the new data reveals three important aspects of pre-pandemic homelessness that could inform our understanding of—and responses to—post-pandemic homelessness: significant increases in the number of people experiencing unsheltered homelessness, high rates of homelessness in states with high housing cost burdens, and an ongoing disparate impact of cost burdens and homelessness on people of color.
Unsheltered Homelessness Driving the Increase
According to HUD’s PIT estimates, the number of people experiencing homelessness rose by nearly 13,000 from January 2019 to January 2020, which was entirely due to a 15,000-person increase in unsheltered homelessness, which offset the 2,000-person decrease in sheltered homelessness (Figure 1). People experiencing sheltered homelessness are those staying in emergency shelters, transitional housing, or safe havens, while people experiencing unsheltered homelessness are sleeping in places not ordinarily meant for sleeping, including streets, parks, and vehicles. (People doubled up with friends or family are not included in the counts, which is part of the critique that PIT estimates undercount homelessness). The majority of people who experienced homelessness in January 2020 were in shelters, totaling around 350,000 people, whereas the number of people outside of shelters was around 225,000; 2020 marked the fifth consecutive year in which unsheltered homelessness increased while sheltered homelessness decreased. Three states accounted for more than half of the increase in unsheltered homelessness: California (5,000), Texas (2,000), and Washington (1,200).
Figure 1: Unsheltered Homelessness Is Driving the Increase in Overall Homelessness
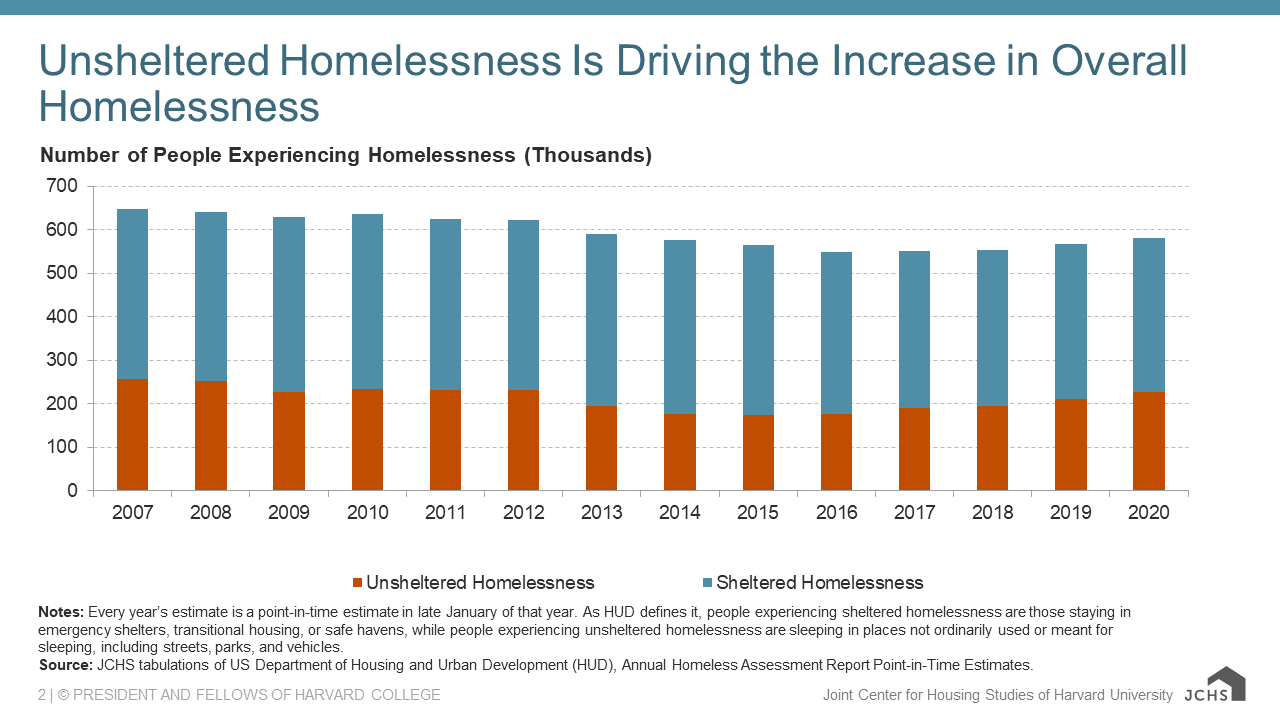
Notes: Every year’s estimate is a point-in-time estimate in late January of that year. As HUD defines it, people experiencing sheltered homelessness are those staying in emergency shelters, transitional housing, or safe havens, while people experiencing unsheltered homelessness are sleeping in places not ordinarily used or meant for sleeping, including streets, parks, and vehicles.
Source: JCHS tabulations of US Department of Housing and Urban Development (HUD), Annual Homeless Assessment Report Point-in-Time Estimates.
Unaffordable States Have the Highest Rates of Homelessness
States with the highest share of households facing cost burdens (paying more than 30 percent of income on housing) are also those with the highest rates of homelessness. The three states with the highest cost burden rates in 2019 were also the three states with the highest rates of homelessness in January 2020: California, Hawaii, and New York. In California, 40 percent of households were cost burdened, and the ratio of people experiencing homelessness was 41 people per 10,000 residents. In Hawaii, the cost burden rate was 39 percent and the homelessness ratio was 46 people per 10,000 residents, while in New York, the cost burden rate was 36 percent and the homelessness ratio was 47 people per 10,000 residents. The correlation between ratios of homelessness and cost burdens nationwide is strongly positive, and these correlations are present for both sheltered and unsheltered homelessness, which can be seen in the interactive chart below (Figure 2).
Figure 2: Homelessness Is Higher in States with High Cost Burdens
Disproportionate Rates of Homelessness Among People of Color
In addition to homelessness being higher in the least affordable states, homelessness is disproportionately high among people of color. These disparities are clear when ratios of homelessness are calculated for each racial/ethnic group. In January 2020, there were 67 Native Americans experiencing homelessness per 10,000 Native Americans in the country, the highest ratio among any racial/ethnic group that year. Among Black people, the ratio was 54 per 10,000, and among people of Hispanic origin (any race), the ratio was 22 per 10,000. In contrast, the ratio for white people experiencing homelessness was 12 per 10,000, and there were four Asian people experiencing homelessness per 10,000 (Figure 3). People of color are also the most likely to be cost burdened: 43 percent of non-Hispanic Black, 40 percent of Hispanic, 32 percent of Asian, and 32 percent of Native American households were cost burdened in 2019, compared to 25 percent of non-Hispanic white households. This highlights the precarious situation for people of color prior to the pandemic.
Figure 3: People of Color Disproportionately Represented Among Those Experiencing Homelessness
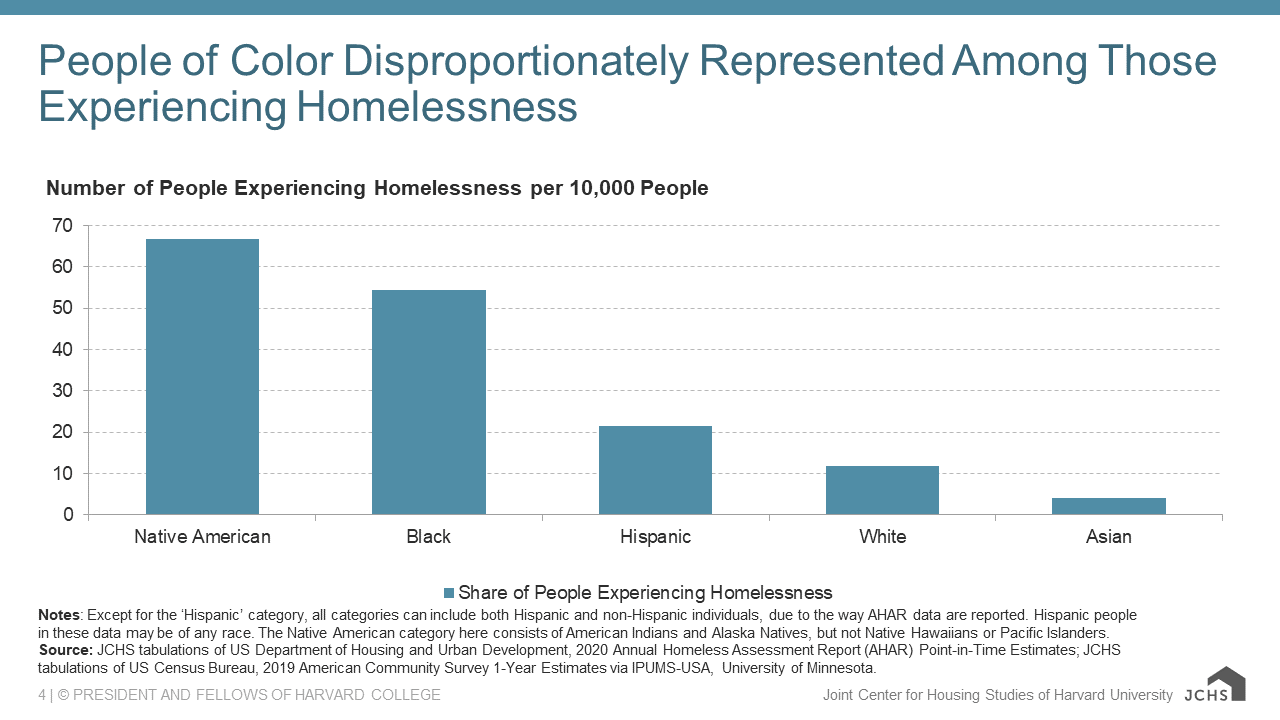
Notes: Except for the ‘Hispanic’ category, all categories can include both Hispanic and non-Hispanic individuals, due to the way AHAR data are reported. Hispanic people in these data may be of any race. The Native American category here consists of American Indians and Alaska Natives, but not Native Hawaiians or Pacific Islanders.
Source: JCHS tabulations of US Department of Housing and Urban Development, 2020 Annual Homeless Assessment Report (AHAR) Point-in-Time Estimates; JCHS tabulations of US Census Bureau, 2019 American Community Survey 1-Year Estimates via IPUMS-USA, University of Minnesota.
What Does This Mean for Post-Pandemic Homelessness?
The pre-pandemic increase in the number of people experiencing unsheltered homelessness is concerning both from a health perspective and from a policy perspective since it implies that resources for providing housing solutions were strained even before COVID-19. Our analysis of the Census Bureau’s Household Pulse Survey found that both renters and homeowners have lost income and fallen behind on housing payments during the pandemic, and another recent poll found that 25 percent of renters and 11 percent of homeowners would become homeless if they lost their current residence (others indicate they would be able to find housing or double up with friends or family). Our analysis has also found that renters and people of color have been particularly hard hit by the financial impacts of the pandemic.
There have, however, been many local, state, and federal policy responses to assist people experiencing homelessness and/or struggling with housing payments during the pandemic. These policies have included rent assistance, economic impact payments, eviction and foreclosure moratoria, and funding for non-congregate shelters for people experiencing homelessness. The recent American Rescue Plan included $27.4 billion in rent assistance and $5 billion in homelessness assistance. While these policies have provided lifelines for many people, the pre-pandemic trends in homelessness raise the risk of increased homelessness after the pandemic if these efforts and resources are not maintained or expanded.