The Return of Substandard Housing
The magnitude of the housing bust that began in the middle of the past decade is well documented, with a 75 percent plunge in housing starts, 45 percent decline in existing home sales, and 30–35 percent slide in house prices. Less well known is how the housing bust and the ensuing cutbacks in residential investment have eroded the condition of existing homes.
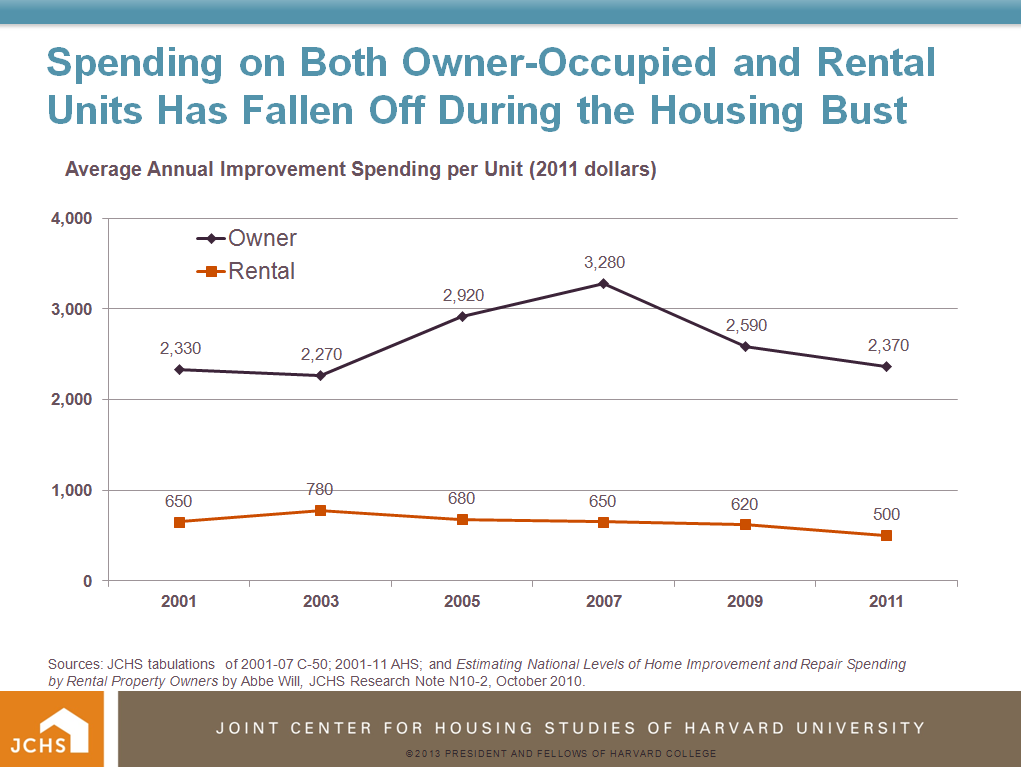
Reasons for concern over the potential for underinvestment in the housing stock are numerous, from the aging of the rental stock to the rising share of homeowners with underwater mortgages to the surge in foreclosures and short sales. In fact, there has been a significant decline in spending on homes during the housing bust. Average annual improvement spending by owners declined 28 percent between 2007 and 2011 after adjusting for inflation, totally erasing the run-up in spending during the boom years. Rental units never saw a run-up last decade, so per unit spending was down 23 percent between 2001 and 2011.
Figure 1

There has been surprisingly little concern in policy circles that this significant reduction in housing investment might be producing deterioration in our housing stock. Thanks largely to the success of government housing programs and the increasing affluence of our population, the condition of the housing stock has largely dropped from policy makers’ radar screens in recent decades.
The first Census of housing in 1940 labeled 45.4 percent of owner-occupied units as substandard, which was defined as housing which lacked complete plumbing facilities or was dilapidated. This share dropped sharply over the next several decades, falling all the way to 6.1 percent in 1970 according to Clemmer and Simonson’s analysis in a 1983 article in the AREUEA Journal. Because measures of housing quality were dropped after the 1970 Census due to unreliability of data and the subjective measurement of structural quality, more recent statistics on the number of substandard units are not available from the Census.
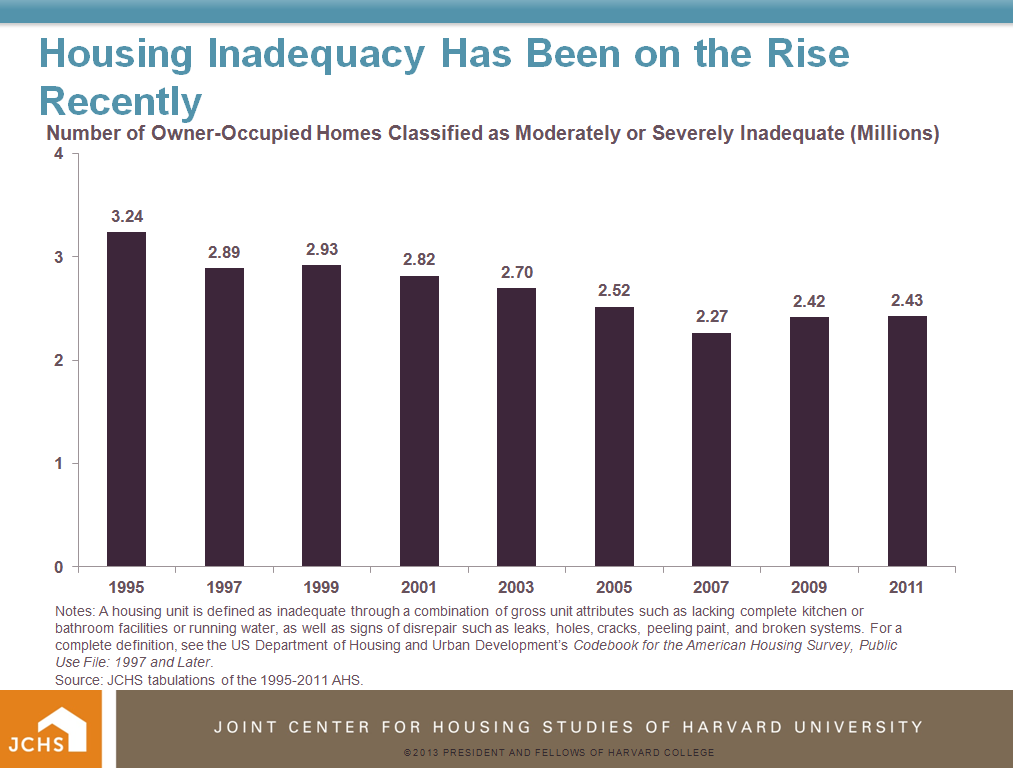
However, beginning in the early 1970s, information from the American Housing Survey (AHS) points to the structural condition of the housing stock continuing to show slow but continuous improvement. As of the 2007 AHS, just 2.27 million owner-occupied homes, or 3.0 percent of the total, were characterized as moderately (with fairly minor structural problems) or severely inadequate (with more major structural problems), down from 3.24 million or 5.1 percent of the total in 1995.
Figure 2

Since the housing market bust, however, this trend has reversed. By 2011, more than 2.4 million owner-occupied homes were classified as inadequate, an increase of 160,000 from the 2007 AHS. While this increase seems fairly minor in the big picture, the importance of it is not. Given available data, this appears to be the first significant increase in the share of homes with structural problems since the government was able to track them beginning with the 1940 census.
Now that the housing market is recovering and residential investment is increasing, this dip in the quality of the housing stock may well reverse as these homes are improved. However, recent Joint Center analysis concludes that once a downward cycle in housing quality is underway, for many homes it doesn’t get reversed. This analysis focused on owner-occupied homes that were characterized as inadequate in 1997, looking at their experience over the following decade but before the dramatic rise in distressed properties.
According to the 1997 AHS, 4.4 percent of owner-occupied homes were considered inadequate. By 2007, these units accounted for almost 8 percent of homes in this 1997 cohort that were no longer owner-occupied (vacant, or converted to rental or nonresidential uses), suggesting that they were less in demand. Even more telling is that these inadequate units accounted for almost 17 percent of all 1997 owner-occupied homes that were demolished within the decade.
The longer-term fate of the current slightly larger number of inadequate homes is unknown. Many of these homes likely will be renovated to provide affordable housing opportunities. However, many may not recover without extra help. Given the extraordinary circumstances that many homes have gone through in recent years, particularly foreclosed homes that often were vacant and undermaintained for extended periods of time as they worked their way through the foreclosure process, they may be more at risk than their inadequate predecessors. It’s probably time to put the structural condition of the housing stock back on the housing policy agenda.

