Rural Areas Saw Disproportionate Home Price Growth During the Pandemic
Home prices rose at an unprecedented pace after the start of the COVID-19 pandemic, the result of record-low interest rates, the continued aging of millennials into prime homebuying years, and a historically limited supply of housing available for purchase. According to Zillow, for example, typical home values in the US increased 36 percent between March 2020 and March 2023, from $244,000 to $332,000. But this rapid home price growth was not uniform geographically. The expansion of remote work enabled many households to look further afield for housing, accelerating migration trends away from larger, higher-cost places in favor of lower-density, lower-cost counties and rural areas.
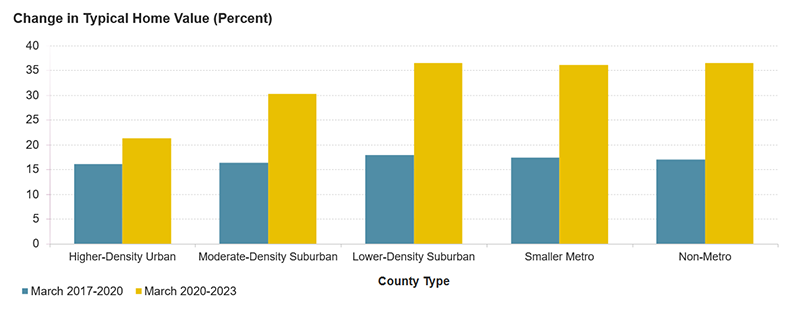
In a new working paper, "The Geography of Pandemic-Era Home Price Trends and the Implications for Affordability," we find that home price growth was especially rapid in rural, lower-density county types. Indeed, in the three years following the start of the pandemic, typical home values increased by 36 percent in low-density suburbs of large markets, in smaller markets, and in rural areas (Figure 1). At the same time, home value growth was still substantial but comparatively modest in the moderate-density suburban counties (30 percent) and higher-density urban counties (21 percent) of large metros with at least 1 million people. This represents a significant shift from pre-pandemic trends. Home price growth was less rapid and more uniform across all county types in the three years before the pandemic.
Figure 1: After the Start of the Pandemic, Home Values Rose Most Rapidly in Lower Density Areas and Rural Counties
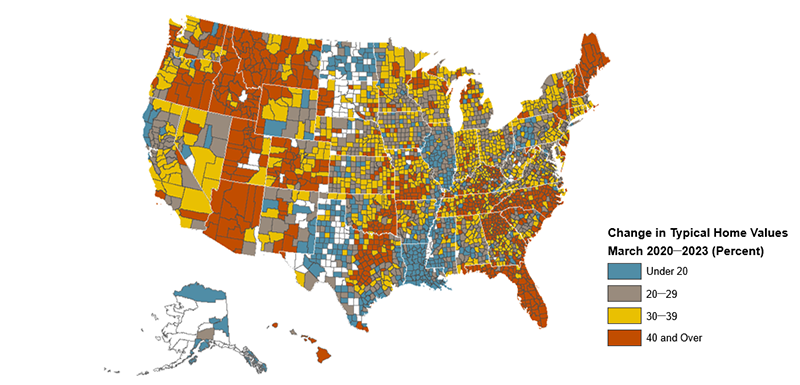
Since the start of the pandemic, home price growth has been remarkably widespread. Home prices rose more than 30 percent in nearly two-thirds of counties between March 2020 and March 2023, including an increase of at least 40 percent in a quarter of counties (Figure 2). Home prices rose rapidly in non-metro counties in particular, with prices in an astounding 31 percent of all non-metro counties growing by at least 40 percent over this period. By contrast, just 18 percent of denser urban counties had price growth exceeding that threshold.
Figure 2: Home Values Rose Markedly in Most Counties
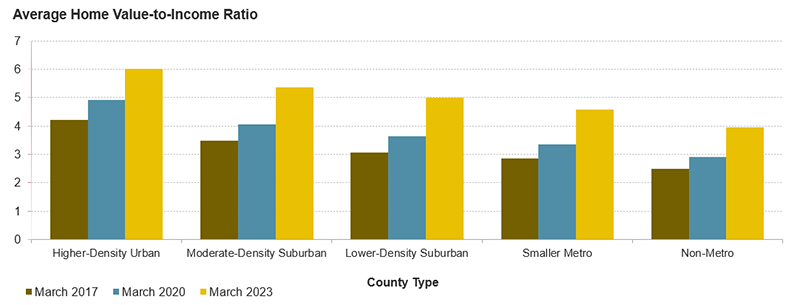
Outsized home price growth in less dense county types worsened homebuyer affordability dramatically in those areas. Estimates of home-value-to-income ratios are a key measure of affordability, particularly for existing or long-time residents. The average home-value-to-income ratio increased the most in non-metro counties, where household incomes are generally lower, from 2.5 in March 2017 to 3.9 in March 2023 (Figure 3). In other words, home values rose to nearly four times higher than the median household income in these counties, approaching the level of higher-density urban counties before the pandemic. Affordability was worst in dense urban counties, with home values 6.0 times higher than incomes in 2023.
Figure 3: Relative to Existing Income Levels, Affordability Deteriorated in Every Market Type
Unprecedented home price growth during the pandemic has led to a concerning decline in homebuyer affordability, especially in places that were previously more affordable. Rising interest rates have compounded those affordability challenges, making buying a home even more costly. Whether disparate home price trends persist into the future will depend on many factors, especially remote work trends, differences in affordability, and the capacity of the stock in these places – both existing and new – to accommodate household growth and shifting preferences.


