Our Disappearing Supply of Low-Cost Rental Housing
It’s not an illusion: low-cost rental housing in the US is disappearing. And our 2017 State of the Nation’s Housing report has the numbers to prove it.
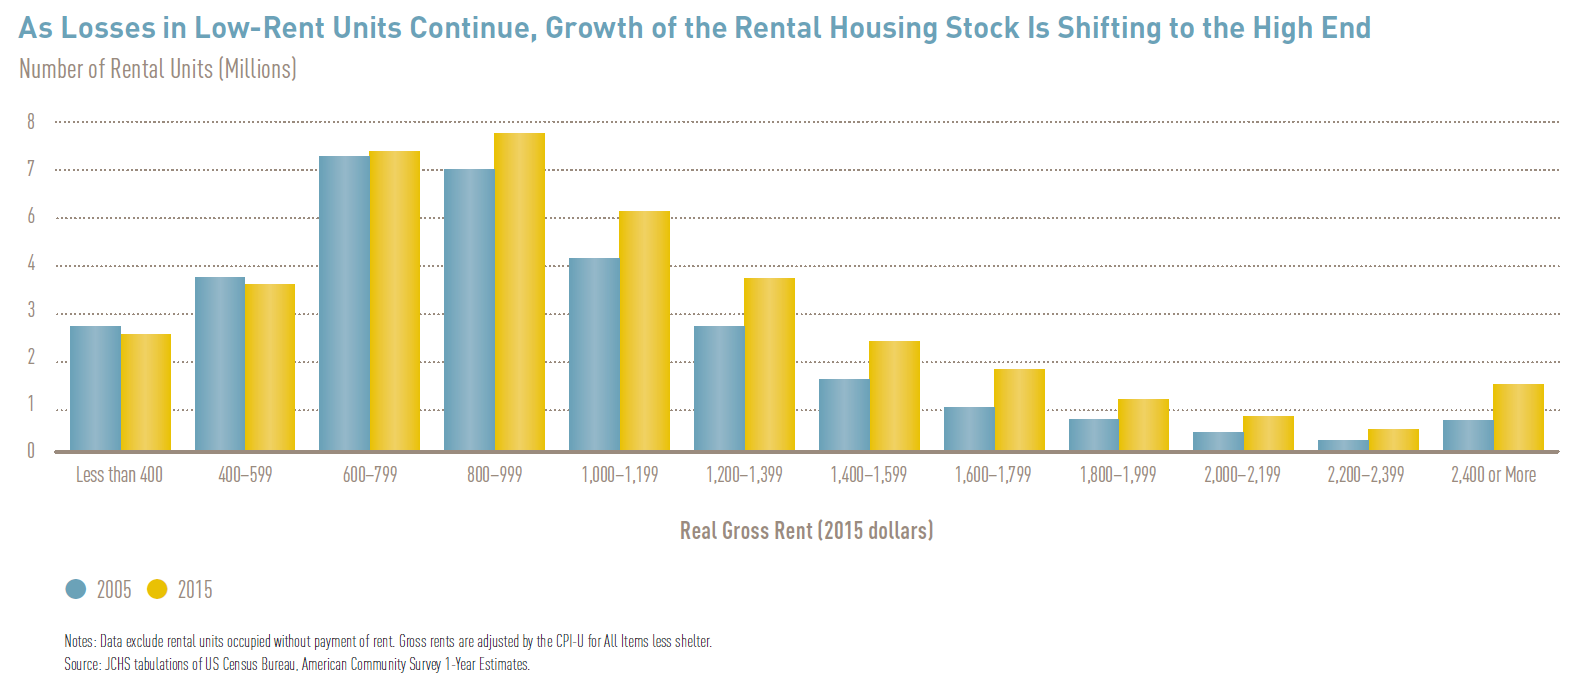
Using ACS data from 2005 and 2015, our new report shows how gains in the supply of high-end units and losses of low and modest-priced units over the past decade has shifted the entire rental stock toward the high end. Nationwide, the number of units renting for $2,000 or more per month (in constant, inflation-adjusted dollars) nearly doubled between 2005 and 2015, while the number of units renting for below $800 fell by 2 percent (Figure 1).
Figure 1: Across the US
Released in conjunction with the report, our new interactive tool shows how this shift played out differently in the nation’s 100 largest metropolitan areas. Metros reporting the most dramatic losses of units renting for less than $800 per month included Austin, Seattle, Portland, and Denver – all places where apartment markets heated up in recent years.
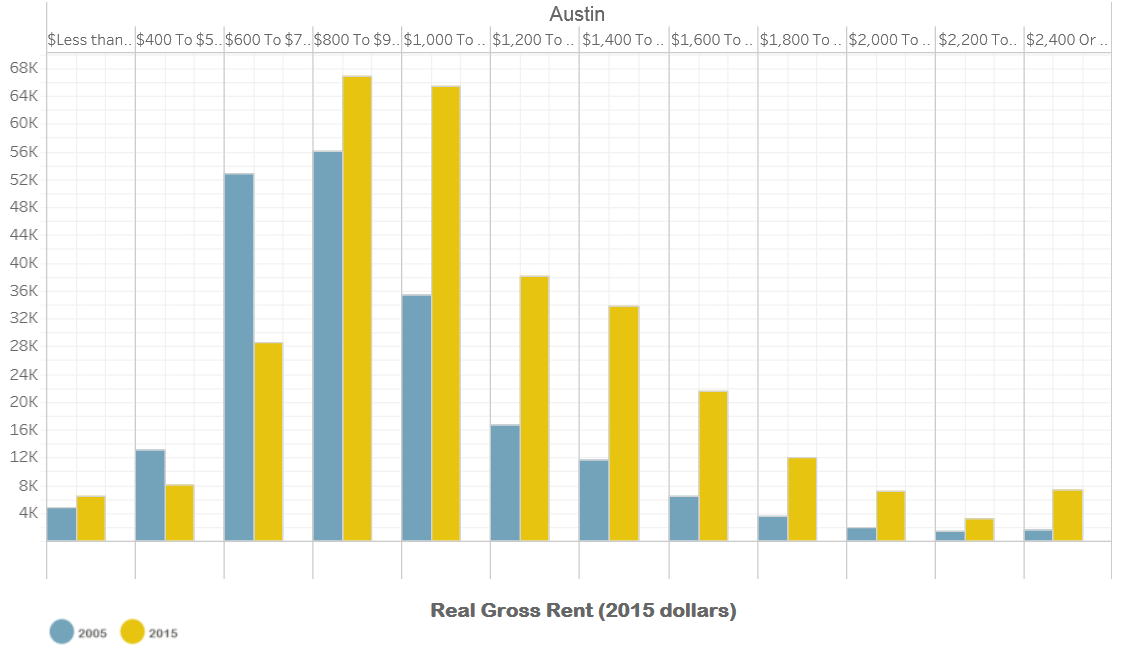
Austin’s transformation was particularly striking. The number of units with rents under $800 declined by nearly 40 percent (a loss of around 27,000 units), while those with rents at $2,000 or more increased more than three-fold (Figure 2).
Figure 2: Austin
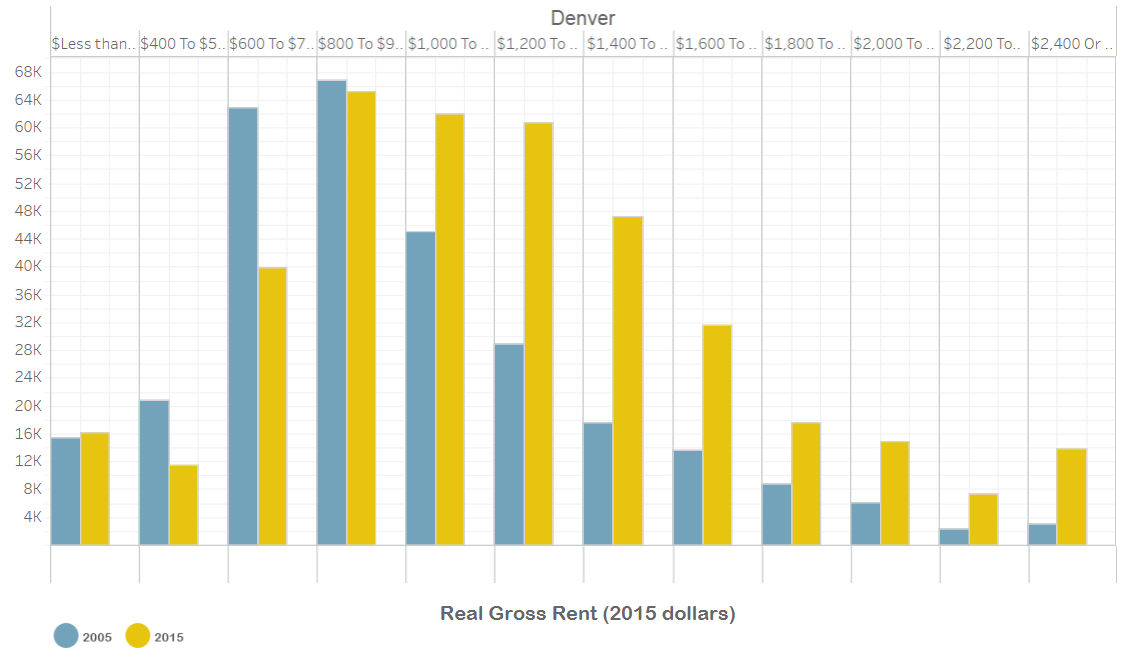
The pattern was similar in Denver, where the number of units renting for under $800 declined by nearly a third, a loss of 31,000 modest-priced rentals, even as the number of units with rents over $2,000 per month tripled, an increase of more than 24,000 units (Figure 3).
Figure 3: Denver
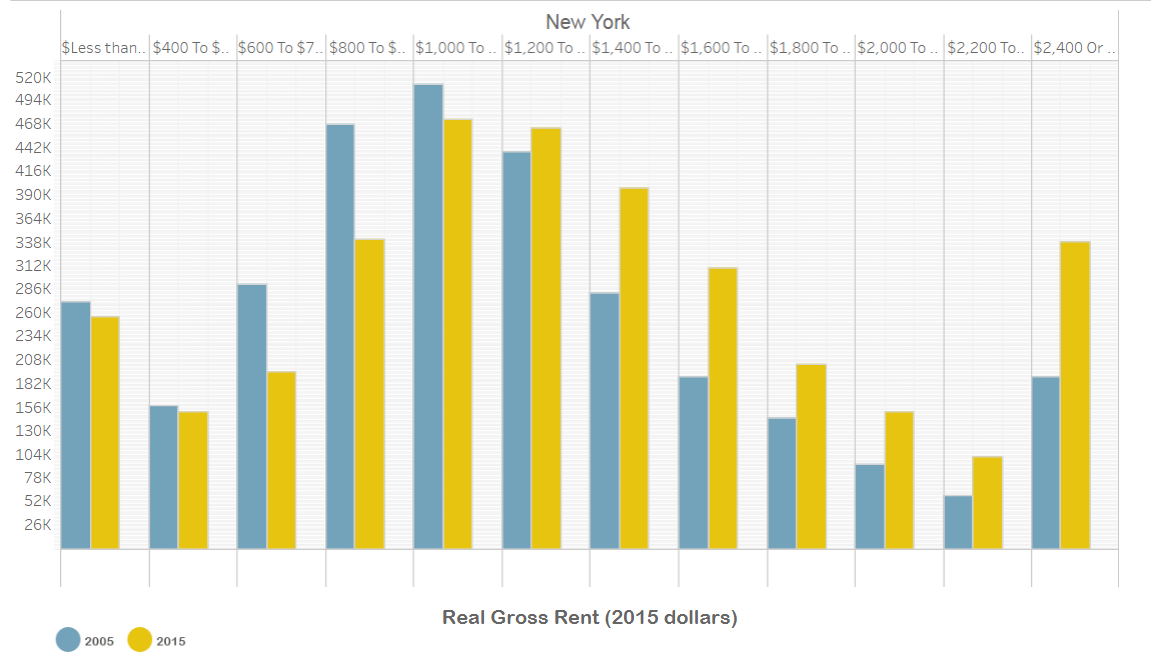
The largest aggregate increases in high-cost rentals took place in the New York, Los Angeles, San Francisco, and Washington DC metro areas. According to ACS data, the New York metro added nearly 250,000 units renting for more than $2,000 per month, while it lost more than 120,000 units renting for less than $800 a month (Figure 4).
Figure 4: New York
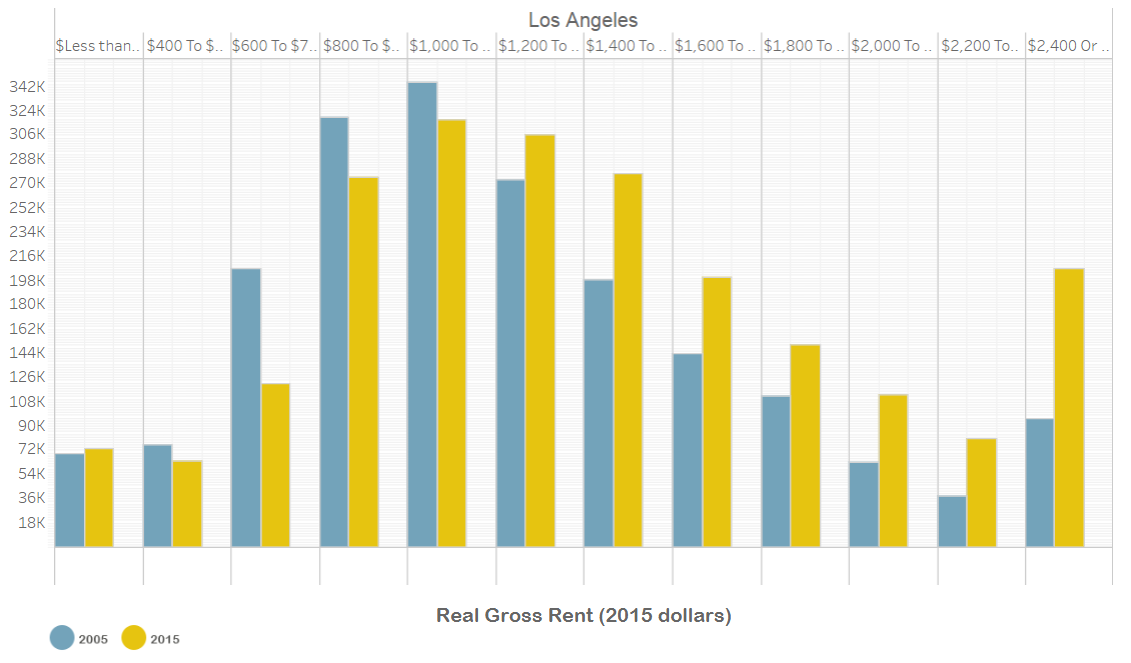
Los Angeles underwent a similar shift in rental stock, losing over 94,000 units renting for less than $800 between 2005 and 2015, while gaining over 200,000 high-cost units (Figure 5).
Figure 5: Los Angeles
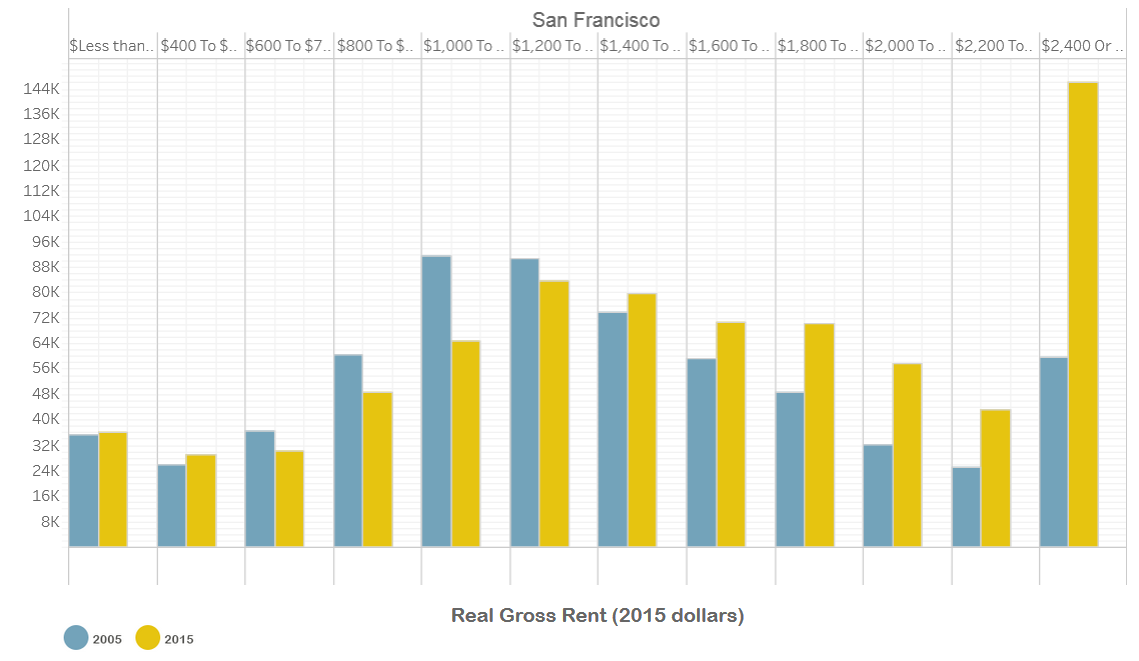
The San Francisco and Washington DC metropolitan areas both added over 100,000 high-cost rental units. In San Francisco, the highest-cost rental segment (those renting for more than $2,400 per month) underwent particularly rapid growth, rising by 145 percent, from almost 60,000 units in 2005 to more than 146,000 units in 2015. In contrast, the stock of low-priced rentals in the region, which was quite low in 2005, was virtually unchanged over the subsequent decade (Figure 6).
Figure 6: San Francisco
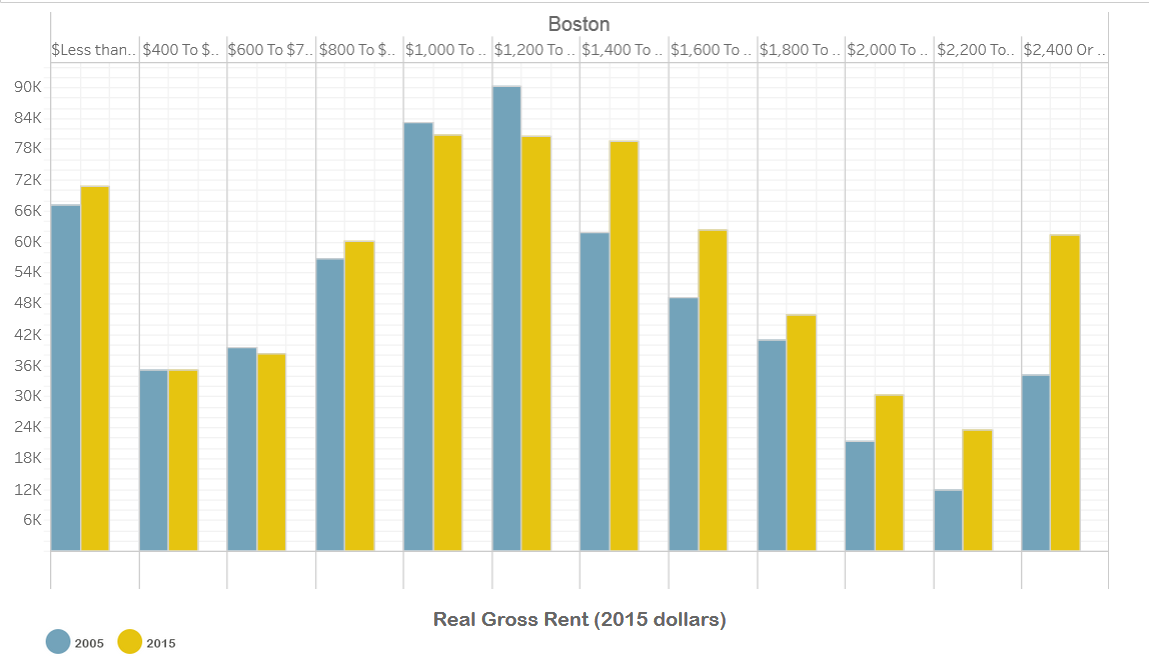
In general, areas with large numbers of assisted rental units saw little or no growth in their stock of low-priced rentals but significant growth in the most expensive units. For example, the number of units renting for less than under $800 in the Boston metro was basically unchanged, while the number of units renting for more than $2,000 grew by 70 percent (Figure 7).
Figure 7: Boston
Because of such shifts, in most metro areas the share of units that rented for less than $800 a month fell between 2005 and 2015. In Austin, for example, the share of units renting for under $800 per month declined from over a third in 2005 to less than 15 percent in 2015. Similarly, the share of units renting for under $800 per month in New York City metro, home to around 3.5 million renter households, dropped from 23 percent of all units in 2005 to just 18 percent in 2015. And in the Washington, D.C. metro, the number of units renting for less than $800 per month dropped from 15 percent in 2005 to just 10 percent in 2015.
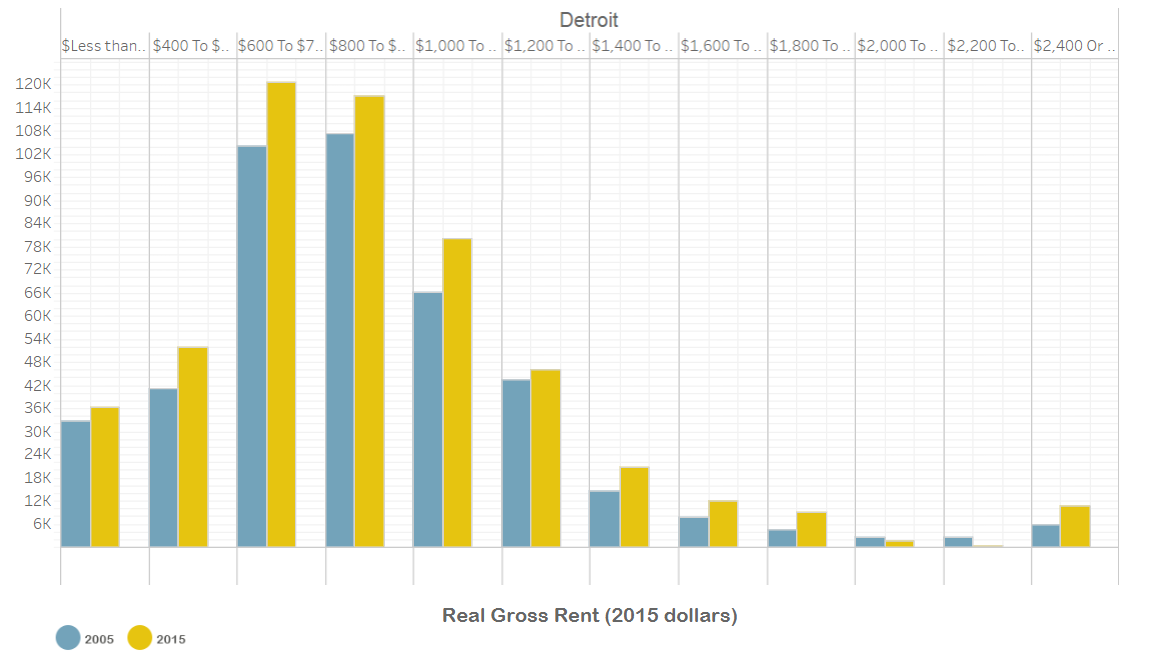
In contrast, both the number and the share of low-rent units rose in a few metros, including the Las Vegas, Cleveland, Sacramento, and Detroit metros. These areas tended to have larger numbers of distressed properties as well as lower rates of economic growth and multifamily construction, which combined to hold down the growth in real rents between 2005 and 2015. In Detroit, for example, there was a 17 percent increase in the share of units renting for less than $800 a month and only a small rise in the number of high-rent units (Figure 8).
Figure 8: Detroit
Use our interactive tool to see how the distribution of rental units changed in the nation’s 100 largest metro areas between 2005 and 2015.
Download an Excel file with the data for each metro area (W-16).


