Housing Markets Leaving Lowest Income Households Behind

Our 2023 State of the Nation’s Housing report shows that while the growth in home prices and rents has slowed, housing costs are still high and record numbers of renters are severely cost-burdened. The report also finds that the rising costs of construction have made it more unlikely that markets alone can address the lack of low-cost housing at the root of the affordability crisis, and that more federal action is needed to address the market failure. While putting faith in political action at the federal level is questionable, the report also finds that pandemic-era housing initiatives helped keep many people in their homes, suggesting that we as a nation can take steps to address housing challenges in meaningful ways.
Despite a Slowdown, Home Prices and Rents Remain High
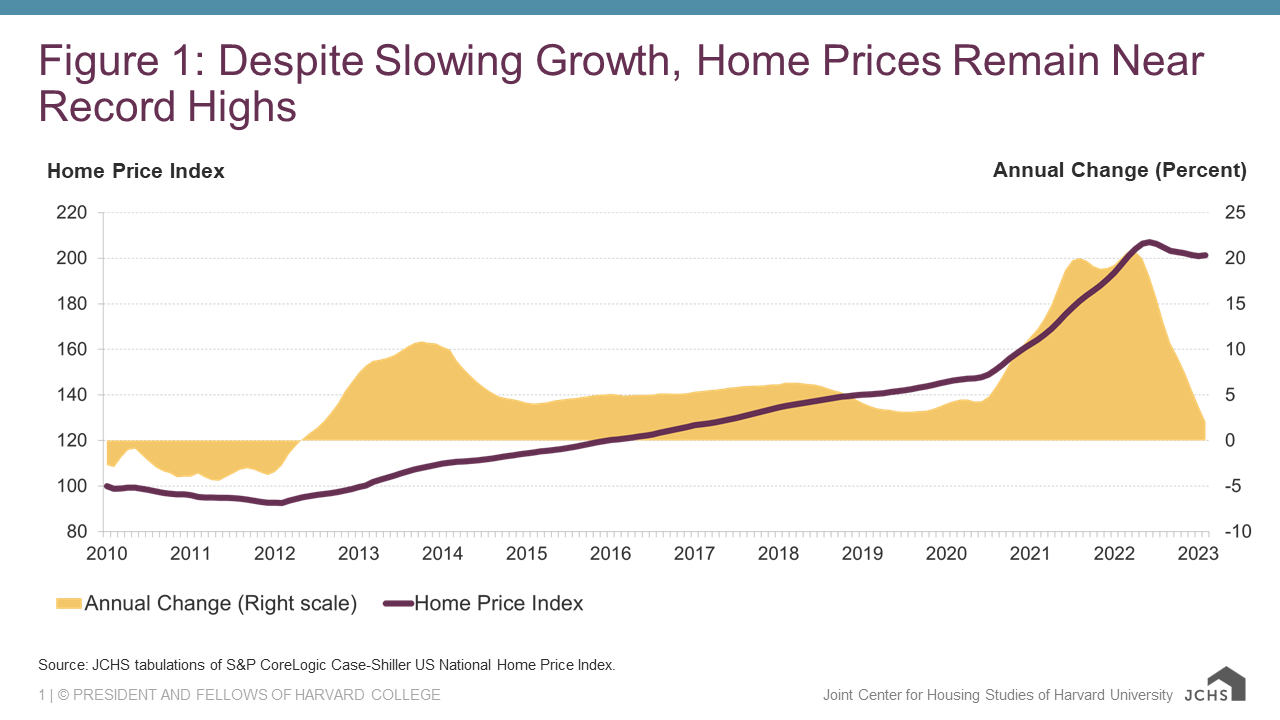
The rise in mortgage interest rates, inflation, and growing concerns about affordability and the economy all contributed to the slowdown in home price appreciation and rent growth. According to the S&P CoreLogic Case-Shiller Home Price Index, home prices increased just 1 percent nationwide between March 2022 and March 2023, after increasing 21 percent in the previous 12 months. Meanwhile, apartment rents grew by 4.5 percent during the same time frame, down from 15 percent growth in the previous year. Although the slowing offered some relief, prices rose rapidly in the previous two years, resulting in nominal home prices that were 37.5 higher than they were in early 2020 while nominal rents were up by 24 percent (Figure 1).
Figure 1: Despite Slowing Growth, Home Prices Remain Near Record Highs
The Housing Shortage Limits Choices and Inflates Costs
Shortages in housing across the country have helped keep prices and rents high, which made the slowdown in single-family construction over the past year concerning. There are a wide range of estimates about the US shortfall in housing, but a few simple metrics from the report are noteworthy. First, the share of vacant units for sale, at just 0.8 percent, is the lowest dating back to the 1950s. Meanwhile, the vacancy rate for rental units, at 6.5 percent, is lower than it’s been since the 1980s. With so few units available, options are limited and competition is making housing much less affordable for everyone, while putting lower-income households at a disadvantage.
Building New Homes Is Expensive
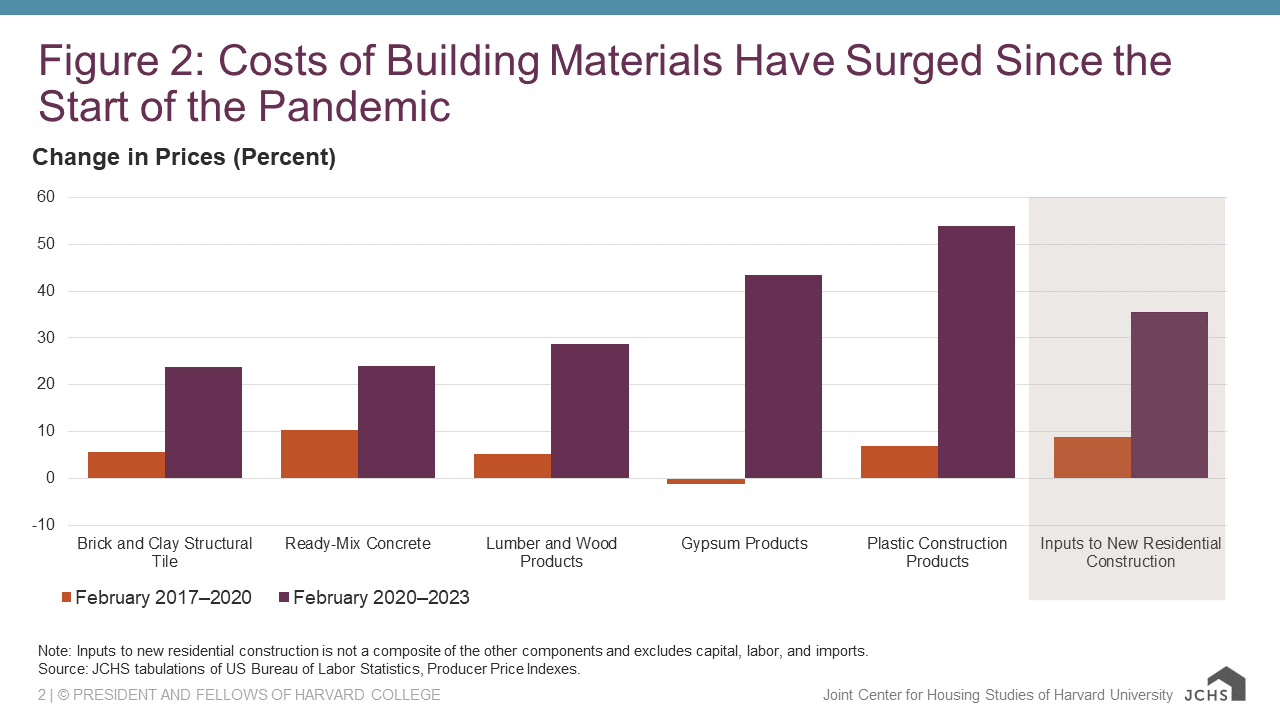
With so few existing homes available, more households look to new homes for a place to live. However, new homes are targeted to higher-end households, which limits the ability of new construction to address housing shortages for moderate-income households. This is not a new phenomenon, but it is increasingly impactful given the high costs of development that have been raised further by higher interest rates and inflation. Even excluding financing and labor costs, inflation in the price of building products has increased the cost of residential construction by 35 percent in the past three years, nearly four times the rate of increase over the previous three years (Figure 2). Regulatory barriers and development fees also push up costs. To account for higher costs, new homes are targeted to those who can afford higher prices, and as a result the homes get bigger and more expensive. In the 1990s, one-third of new homes were smaller than 1,800 square feet; today it’s one in five. In rental markets, where the median asking rent on new units is $1,800 per month, just 5 percent of all newly completed units in 2022 had asking rents at a level affordable to a household with the US median renter income. With these units out of reach, low- and moderate-income households must wait for an affordable unit to free up, which has become increasingly unlikely as the number of low rent units continues to fall.
Figure 2: Costs of Building Materials Have Surged Since the Start of the Pandemic
The Lowest-Income Households Face Severe Burdens
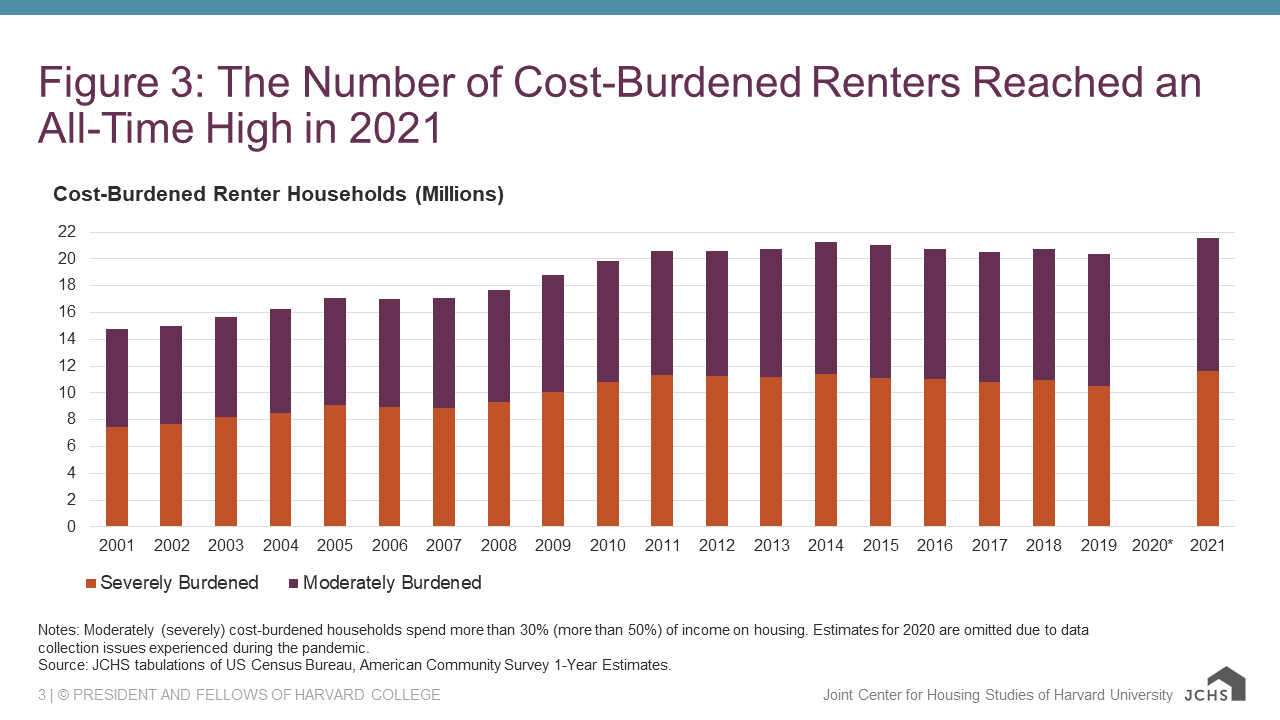
With few housing options affordable and available, households with the lowest incomes stretch to afford higher rent units. According to the National Low Income Housing Coalition, there are only 3.7 million affordable and available units for the nation’s 11 million extremely low-income renter households. As a result, the number of renter households paying more than half their incomes on rent hit a record 11.7 million in 2021, and the majority of these severely burdened renters have incomes below $30,000 (Figure 3).
Figure 3: The Number of Cost-Burdened Renters Reached an All-Time High in 2021
Government Assistance Can Have a Major Impact
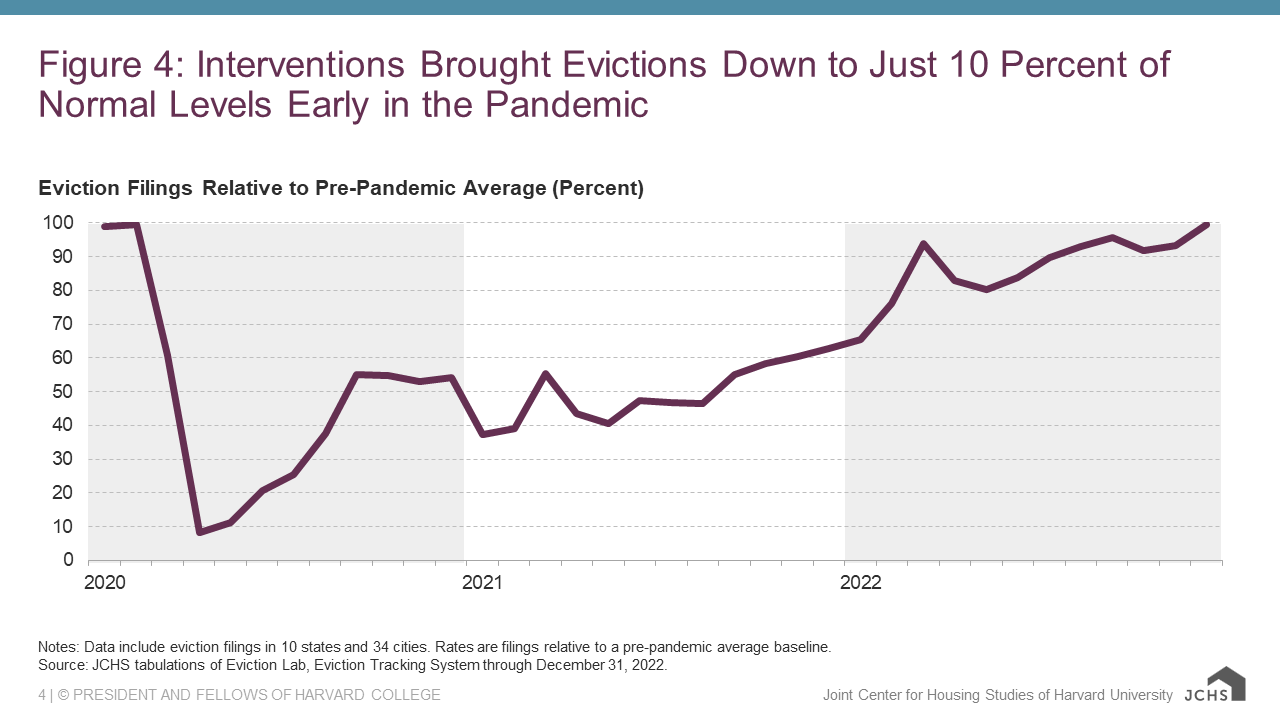
The failure of the market to provide housing at rents attainable for millions of renter households means a substantial increase in housing assistance is needed to fill the gap. Given the scale of the problem, the support must begin at the federal level. The fact that the housing affordability crisis is increasingly a bipartisan concern provides some hope for political action, but the question remains of whether the two parties can agree on solutions. Still, the federal assistance provided to households during the pandemic not only provides evidence that the government can choose to make a substantial investment in housing assistance, but that when it does so, the assistance can have a major impact; the $46 billion Emergency Rental Assistance program and eviction protections brought evictions down to just 10 percent of their average level in early 2020 (Figure 4). Similarly, the mortgage forbearance program helped 8.5 million homeowners avoid foreclosure, and over the past year there was no wave of foreclosures when thousands of households exited the program, as some had feared. In fact, delinquencies remain below pre-pandemic levels with help from the Homeowner Assistance Fund which continues to help owners pay for monthly housing costs.
Figure 4: Interventions Brought Evictions Down to Just 10 Percent of Normal Levels Early in the Pandemic
As evictions have crept back up to pre-pandemic levels, and the number of people experiencing homelessness rises, additional interventions are necessary. Ultimately, it will require a multifaceted, public and private sector approach with investment, advancement, innovation, and collaboration across every aspect of housing production to provide enough housing to meet the needs of millions of low- and moderate-income households who continue to be burdened by high housing costs.


