Our Shrinking Supply of Low-Cost Rental Units
Between 1990 and 2016, the number of rental units in the U.S. priced below $800 per month (in real terms) shrank by nearly 2.5 million. However, over the same period, the number of low-income renters paying cash rents – those making no more than $32,000 annually in real terms, and excluding those living in institutional quarters — grew by more than 4.5 million households, according to data and analyses in the Joint Center’s latest State of the Nation Housing report.
Figure 1: The National Rental Housing Stock Shifted to Higher-Cost Units
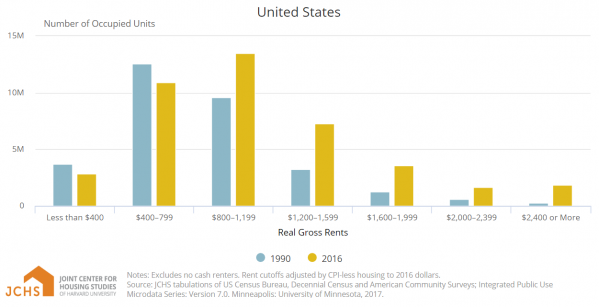
Overall, this drop represented a net loss of 15 percent of the 16.2 million low-cost units that rented for less than $800 (in 2016 dollars) in 1990. This decline was driven by many factors, including demolitions, renovations, conversions of low-rent units to other uses, including owner-occupancy, and of course, annual rent increases that over time pushed real rental costs higher. The loss took place even as the total number of renters rose by over 10 million. As a result of these changes, the national share of units renting for less than $800 shrank from over half in 1990 to only one-third in 2016.
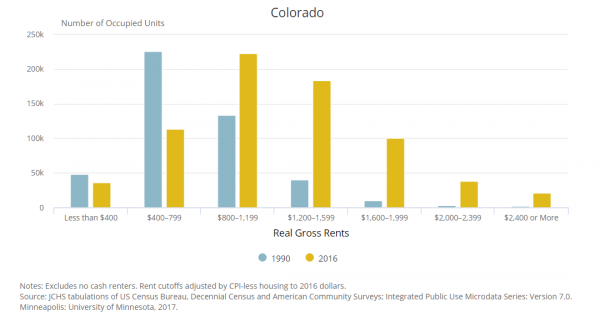
As a new interactive tool, released in conjunction with the report shows, the decline and the shift towards higher-rent units was not consistent across the county. Rather, on net, the stock of low-cost rental units dropped between 40 and 52 percent in Colorado, the District of Columbia, Hawaii, and New York, and dropped by about a third in Maryland, New Jersey, Oregon, and Washington (Figure 2).
Figure 2: Since 1990, Colorado Lost 45 Percent of Rentals Priced under $800
While fully 40 of the 50 states and D.C. witnessed absolute declines in low cost units, there were a handful of states where units renting for less than $800 actually increased in number. Nevada and Arkansas topped this list, followed by North Carolina, Arizona, Georgia, Idaho, and Kentucky. At the same time, however, most of these states witnessed even greater increases in low-income renters (with the exception of Arkansas and Kentucky). Moreover higher-rent units grew at a much faster rate in all 50 states and D.C., so all of them registered declining shares of units renting for under $800 per month.
In many other states, the shift in the distribution of rental units was less dramatic, but it still posed problems for households making less than $32,000 a year (the income needed to ensure that a household renting an $800/month unit does not pay more than 30 percent of their income on rent).
For example, in Texas, the number of units renting in 1990 for less than $800 a month (in 2016 dollars) exceeded the number of households making less than $32,000 a year. However, in 2016, while the number of low-income renters had increased, the number of units renting for less than $800 per month had dropped by 22 percent and the supply of such units no longer exceeded the number of households that could afford them (Figure 3).
Figure 3: Texas Lost More Than 1 in 5 Low-Cost Rental Units

Other states where the supply of low-rent units matched or exceeded the number of low-income renters in 1990, but where the number of low-cost units shrunk considerably by 2016, include Alaska, Arizona, Colorado, Illinois, Florida, Georgia, Minnesota, Oregon, New York, Pennsylvania, Utah, Vermont, Virginia, and Washington. Moreover, in all of these states, the number of low-income renters now far exceeds the number of available low-rent units – yielding a shortage of affordable supply.
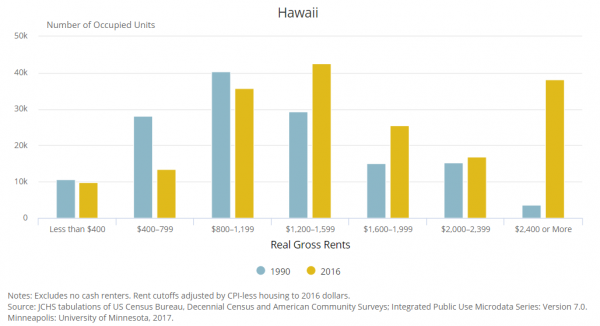
Some high-cost states – such as California, Connecticut, Hawaii, Massachusetts, New Hampshire, New Jersey, and Rhode Island – already had a sizable shortfall of affordable units in 1990 and an even greater shortfall in 2016. The situation in Hawaii is particularly striking. In 1990, only 38,850 units rented for less than $800 per month, but by 2016 this number dropped to just 23,250. At the same time, the overall number of rental units grew from about 142,400 to 181,900. As a result, the low-cost share of rental units in Hawaii declined from 27 percent in 1990 to just 13 percent in 2016. Hawaii also witnessed a striking increase of about 34,500 units renting for more than $2,400 per month (Figure 4).
Figure 4: Hawaii’s Rent Distribution Has Shifted to the High End
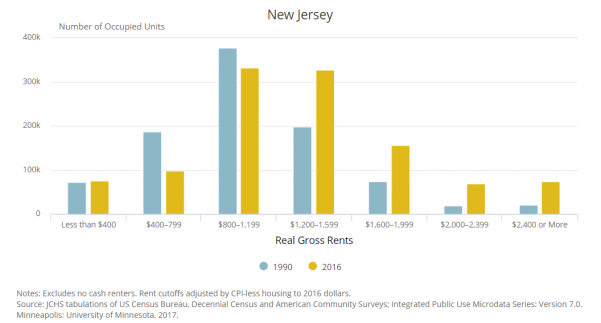
Similarly, in New Jersey, only 258,100 units rented for less than $800 per month in 1990, and this supply fell to 175,000 in 2016 (Figure 5). At the same time, the total number of units grew from 948,300 to over 1.1 million, so the low-cost share of units dropped from 27 percent in 1990 to just 15 percent in 2016. Meanwhile the number of households making less than $32,000 a year also grew from 307,600 in 1990 to over 427,000 in 2016, making New Jersey’s housing shortage for low-wage workers even worse.
Figure 5: New Jersey’s Already-Low Supply of Low-Cost Housing Fell Further
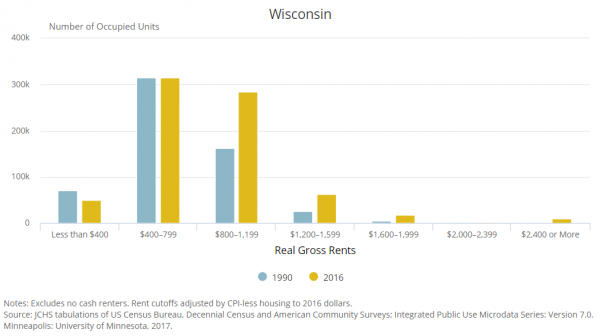
In another set of states, prices for low-end units are generally lower, so similar losses of low-cost units occurred at lower price points. Examples include Indiana, Michigan, Ohio, North Dakota, Oklahoma, South Dakota, Tennessee, Wisconsin, and Wyoming, where the number of units renting for less than $400 declined by between 19 and 60 between 1990 and 2016 (Figure 6).
Figure 6: Wisconsin Lost 29 Percent of Units Priced Under $400
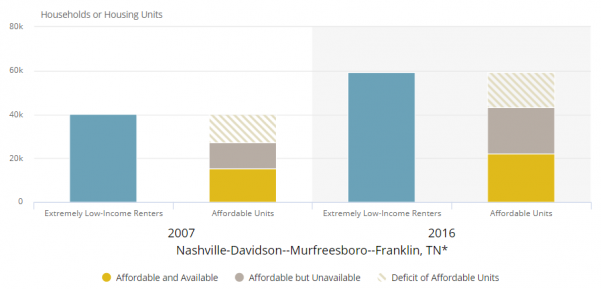
Moreover in all 50 states and D.C. the effective supply of low-rent units was even more scarce due to what housing researchers call an ‘availability gap’ or deficit. This means that higher-income renters frequently occupied lower cost units, crowding out middle-market renters and those further down the income scale from appropriately priced supply. This deficit is discussed in detail in the National Low Income Housing Coalition’s report, The Gap: A Shortage of Affordable Homes 2018. In addition, our interactive tool, based on data from the NLIHC report, illustrates the scale and source of the shortage of affordable housing in specific metros. For example, in Nashville, the deficit of units for extremely low-income renters rose from 24,560 in 2007 to over 37,100 in 2016 (Figure 7). While about 43 percent of this deficit was due to an absolute shortfall of affordable units, another 57 percent was due to the fact that higher-income renters were already occupying affordable, low cost units.
Figure 7: Nashville’s Affordable Housing Gap for Extremely Low-Income Renters
Both of these problems – the lack of affordable units and the availability gap – have led to alarmingly high cost-burden rates for our nation’s lowest income renters. For example, across all 50 states and D.C., between 60 and 88 percent of renters with incomes under $32,000 paid more than 30 percent of their incomes for rent, while between 35 and 67 percent paid more than half of their incomes for rent – leaving less money for other basic household expenses. Additional cost-burden rates for all renters are available by state and metro area in our interactive map. These trends are fueling our nation’s affordability crisis, and particularly, the shortfall of housing needed by our nation’s most vulnerable low-wage workers across nearly all metropolitan areas.