U.S. Households are Using Less Energy
Although the number of U.S. households increased by about 4 percent between 2009 and 2015, total on-site energy usage in occupied U.S. homes declined by more than 10 percent, according to our analyses of survey results recently released by the U.S. Energy Information Administration (EIA).
Overall, while total households increased from 113.6 million in 2009 to 118.2 million in 2015, total site energy use by those households dropped by more than a quadrillion Btu, even as consumption increased among non-residential uses. As a result, the residential sector’s share of total U.S. energy consumption dropped from 22.4 percent in 2009 to 21.1 percent in 2015.
Underlying these improvements was a reduction in U.S. households’ energy consumption per square foot of living space, which fell by 15.6 percent from 45,500 Btu in 2009 to 38,400 Btu in 2015. However, since single-family homes increased in size (especially in the South and West) per-household energy use declined by 14.0 percent, falling from 89.6 million Btu in 2009 to 77.1 million Btu 2015.
While reductions in per-square foot energy usage occurred in all types of housing units, they were steepest for apartments or condominiums in larger multifamily buildings (defined as buildings with five or more units). Illustratively, households living in these units used just 38,800 Btu per square foot in 2015, a drop of 29 percent from 2009. Per-square-foot energy usage also declined by 24 percent in apartments in smaller, two-to-four unit structures, and by 20 percent for mobile homes (Figure 1). In comparison, per-square-foot energy usage in detached single-family homes declined by just 13 percent to 37,100 Btu in 2015.
Figure 1: Household Energy Use Fell Most in Multifamily Structures and Mobile Homes
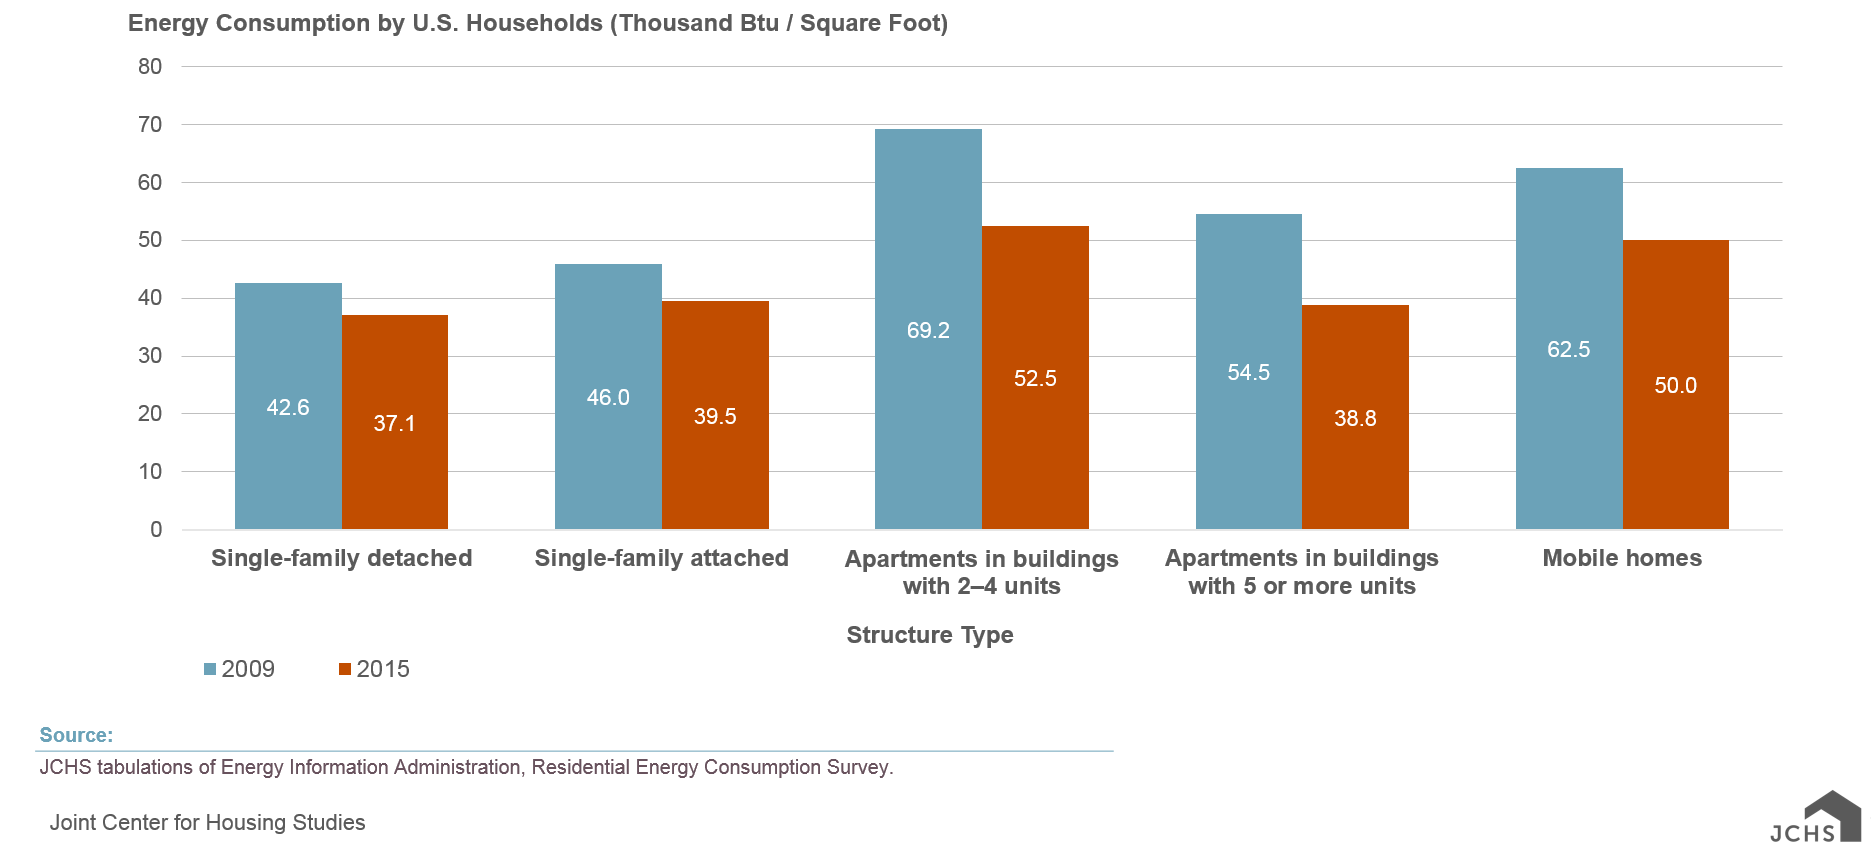
As the figure shows, residents of detached single-family structures used less energy on a per-square-foot basis than residents of other types of units. However, on average, single-family homes are 2.5 times bigger than multifamily units. As a result, people living in detached single-family units also consumed significantly more energy per household – and per person – than people living in any other type of structure. In 2015, average household energy consumption in detached single-family homes was 94.6 million Btu, more than double the usage by households living in units in larger multifamily buildings (excluding energy used in common areas).
Why Did Energy Usage Decline?
Rising temperatures drove a portion of the reduction in energy usage. Notably, a measurably warmer winter across the U.S. in 2015 required less energy for households’ space heating, which is by far the largest end use in the residential sector. However, the reduction in per-square foot energy consumption by U.S. households was widespread. It dropped in hot/humid, temperate, and cold-weather regions, as well as in both urban and rural areas. The largest reductions occurred in the West, where as a result of widespread reductions in multiple end-uses, per-square foot energy usage dropped by 22 percent between 2009 and 2015. While not as significant as the declines in the West, per-square foot energy usage also fell by 16 percent in the Midwest, 13 percent in the South, and 11 percent in the Northeast.
Stricter energy codes for new construction also produced some of the reductions. For example, occupants of single-family housing units built since 2010 used only 27,200 Btu per square foot in 2015, 28 percent less than occupants of older single-family homes (Figure 2). Similarly, households living in newer multifamily units used only 33,500 Btu per square foot on average, 24 percent less energy than those living in older multifamily units. Past EIA surveys (dating back to 1980), show that the tendency for newer housing units to be more energy-efficient has been a long-term trend.
Figure 2: While New Homes Require the Least Energy, Older Homes Also Improved
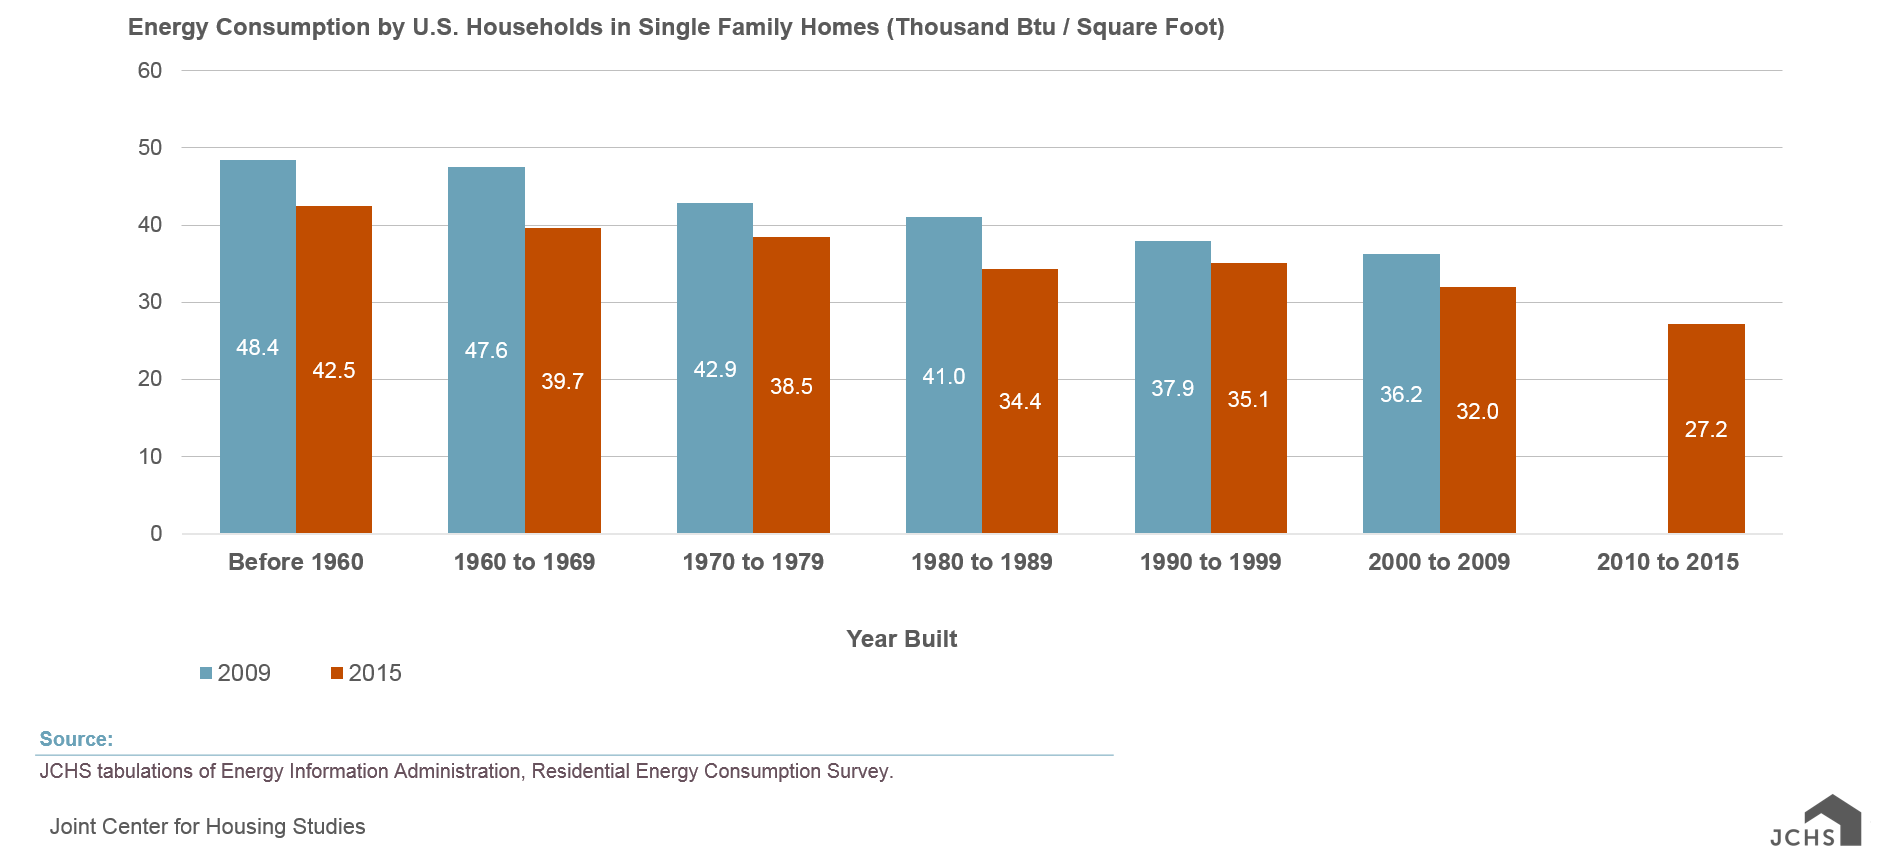
However, due to a combination of factors, energy usage also dropped for households living in older units. Home improvements – such as adding insulation or installing more energy efficient windows, doors, and HVAC systems – helped reduce existing households’ energy usage, as did replacement of existing appliances, lighting fixtures, and electronic devices with more energy-efficient versions. In part as a result of these activities, occupants of units built in the 1960s used 20 percent less energy per square foot in 2015 than they did in 2009—the largest reduction of any housing vintage. In addition, households living in units built before 1960, and in units built in the 1970s and 1980s, used 14 and 16 percent less energy per square foot respectively, while those living in built in the 1990s and 2000s used 11 percent less.
Further identifying the source of the reductions is difficult due to improvements to the EIA’s energy estimation methodology between 2009 and 2015. As they explain, these updates to their methodology impacted certain end-use estimates – particularly for all-electric end uses like air conditioning and refrigerators – across the two years. Yet it remains noteworthy that, according to these best available estimates, consumption decreased across most, but not all residential end uses (Figure 3). Moreover the changes are generally consistent with other broad trends across the two periods.
For example, estimated energy used for space heating, which accounts for 43 percent of on-site energy consumption in US homes, declined by about 9 percent per household between 2009 and 2015, with particularly strong gains concentrated in the West. In addition, estimated usage for heating water, which accounts for 19 percent of on-site usage, dropped by 7 percent. Both of these shifts are consistent with factors cited above, including rising temperatures and ongoing improvements to HVAC equipment.
Meanwhile estimated energy used for refrigerators (3 percent of on-site usage) declined by nearly 40 percent per household while all other non-HVAC applications (such as lighting, appliances, computers, etc.), which account for 26 percent of on-site usage, dropped by 24 percent. Again, there is some uncertainty surrounding these electricity-based estimates owing to the EIA’s new estimation technique. However the direction of change is also consistent with the broader decline in residential energy usage for the period, as well as tighter energy efficiency standards for HVAC and other household appliances.
Figure 3: Households Consumed Less in Most Areas, Except for Air Conditioning
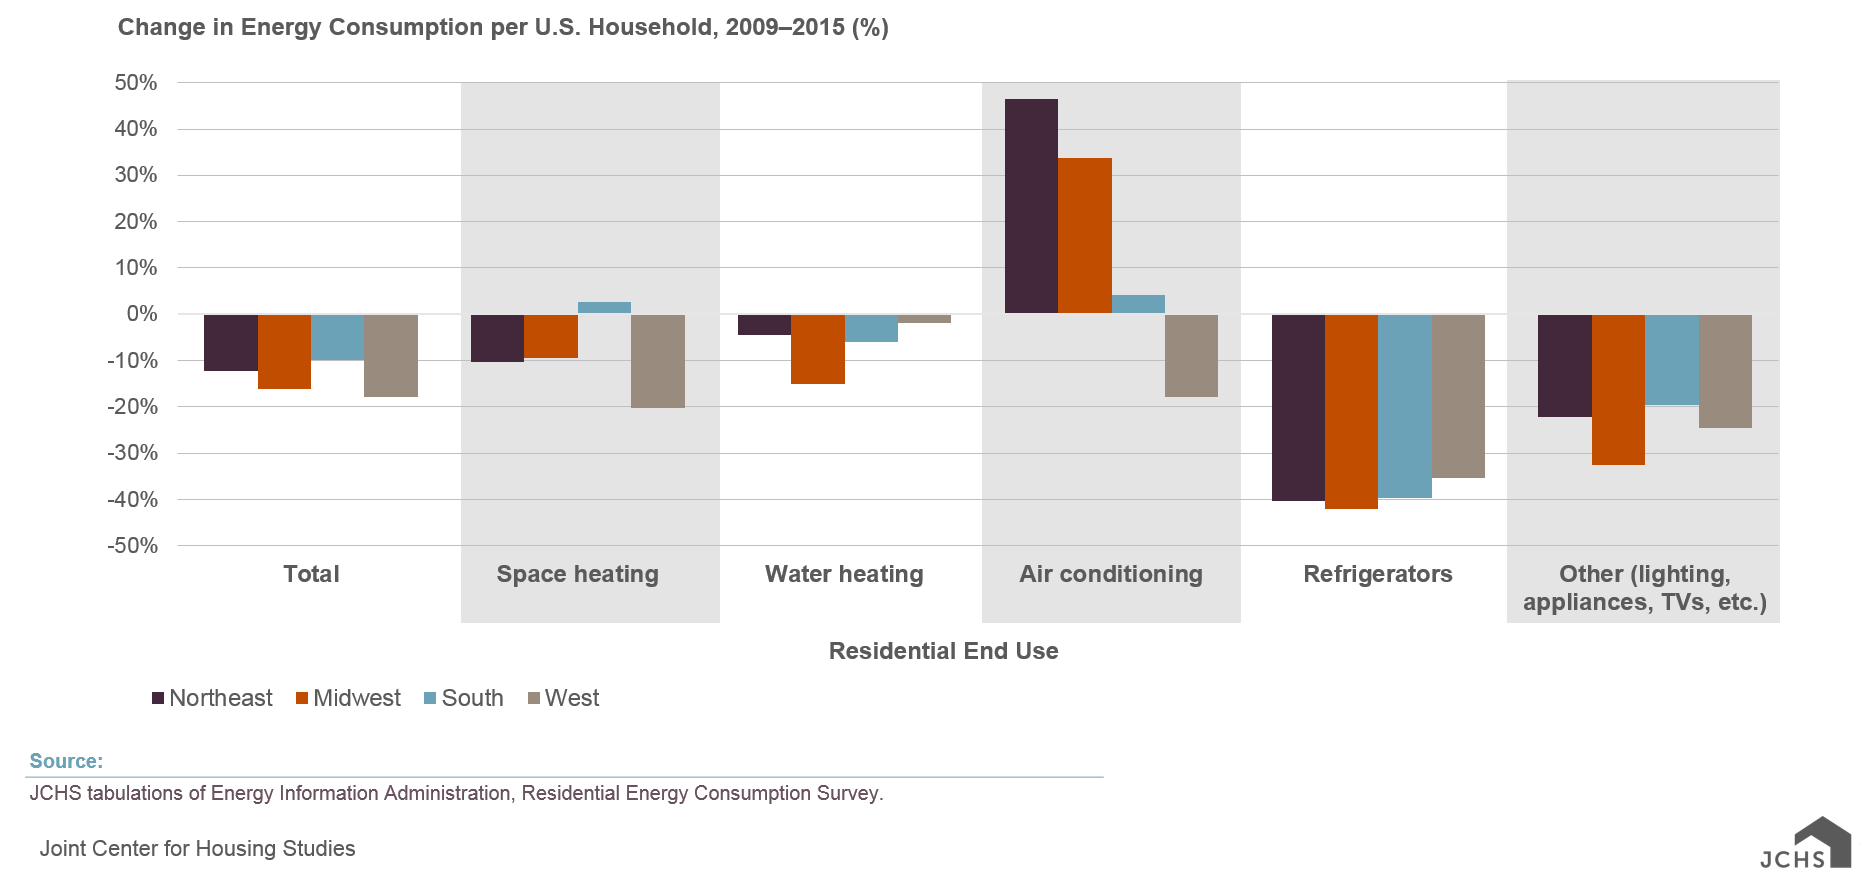
In contrast, estimated per-household energy usage for air conditioning, which accounts for 8 percent of households’ total energy usage, increased by 5 percent over the same period, driven mainly by increased use of air conditioning by residents in the Northeast and Midwest. Rising temperatures – measured by the EIA as a higher number of ‘degree cooling days’ in 2015 – may have played a role in this as a larger share of homes adopted use of air conditioning across all climate regions. Per-household increases in energy consumption for air conditioning were also highly concentrated in older homes (e.g., built before 1970), as well as among owner-occupied condo units and single-family rental homes. However, rising air conditioning usage was more than offset by decreased usage in other areas, such as heating, so average energy consumption for households living in such structures still declined.
Lower Energy Bills, But Energy Insecurity Persists
The reductions in residential unit’s energy usage led to lower average bills for both renters and owners. In real terms, renter households spent 19 percent less on energy in 2015 than in 2009, on average, while homeowners spent 18 percent less. The decrease was greatest for owners and renters living in multifamily units, who, on average, paid nearly 25 percent less in 2015 than they did in 2009.
At the same time, however, the survey also provides a glimpse into how energy costs remain a burden for many households – particularly those with lower incomes. For example, 25 million households – including 11 million with children – reported reducing or forgoing food or medicine to pay for energy-related household expenses in 2015. Nearly 13 million households reported leaving their home at an unhealthy temperature, and over 17 million reported receiving disconnect or deliver stop notices in the past year.
More than half of all Black or African American households reported experiencing some form of energy insecurity over the past year, while some 44 percent of Hispanics, 25 percent of Whites, and 20 percent of Asian households experienced some form of insecurity. American Indian, Pacific Islanders and other multiple race households also experienced a high incidence of energy insecurity at 50 percent.
More detailed information on households’ energy consumption patterns and expenditures, and reports of energy insecurity — including breakdowns by such factors as income, family size, home size, and climate conditions is available at https://www.eia.gov/consumption/residential/data/2015/.