Digging Deeper: Ten Striking Findings from Our Latest State of the Nation’s Housing Report
This year marked 30 years since the Joint Center released its first report in 1988 and this year’s report – like its predecessors – includes a number of statistics that surprised even the experienced researchers who prepare it. Here are ten that strike me as particularly notable from the 2018 report:
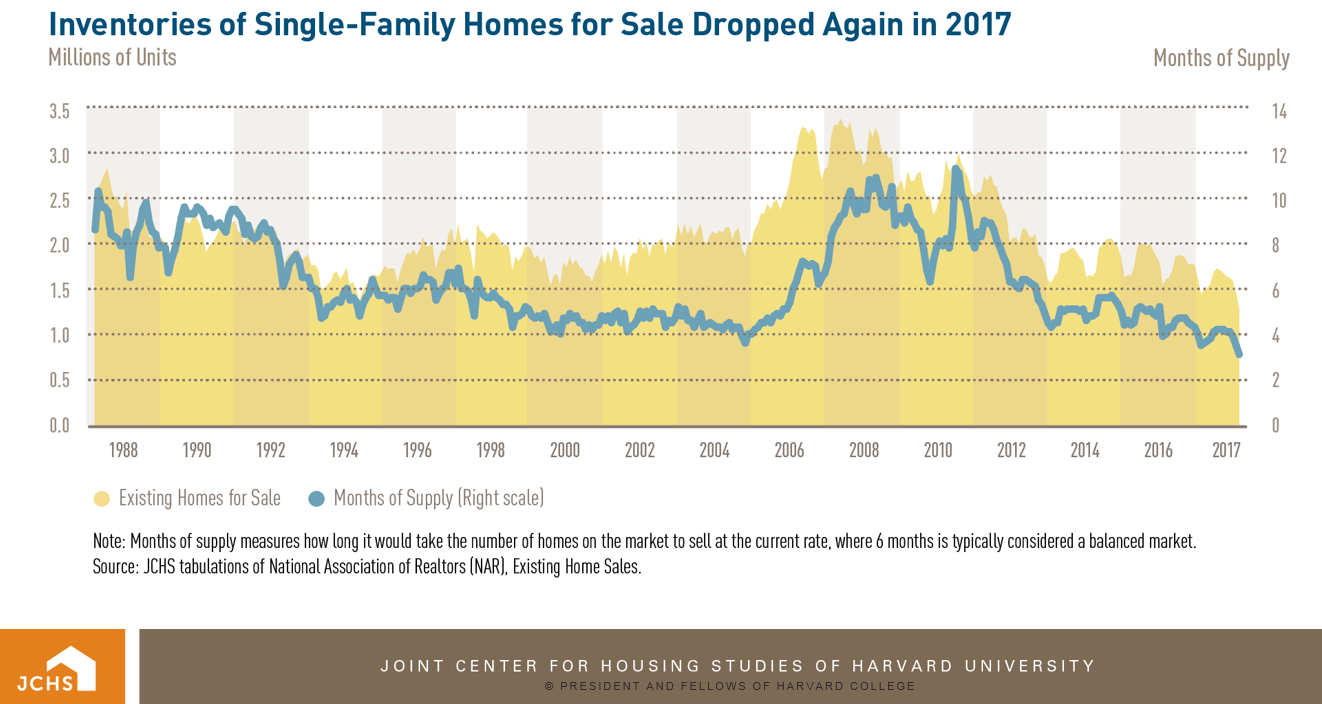
1. The average number of single-family homes for sale during 2017 was lower than at any point since 1982. Inventories, which have been low for several years, declined in 80 percent of the major metros tracked by Zillow. As a result, only one of these metros (Bridgeport, CT) had a for-sale inventory of more than 6 months, the amount commonly used to indicate a balanced housing market. One factor behind the lack of new inventory was that the U.S. added fewer new single-family units over the last 10 years than any 10-year total going back to the early 1960s – just 614,000 annually.
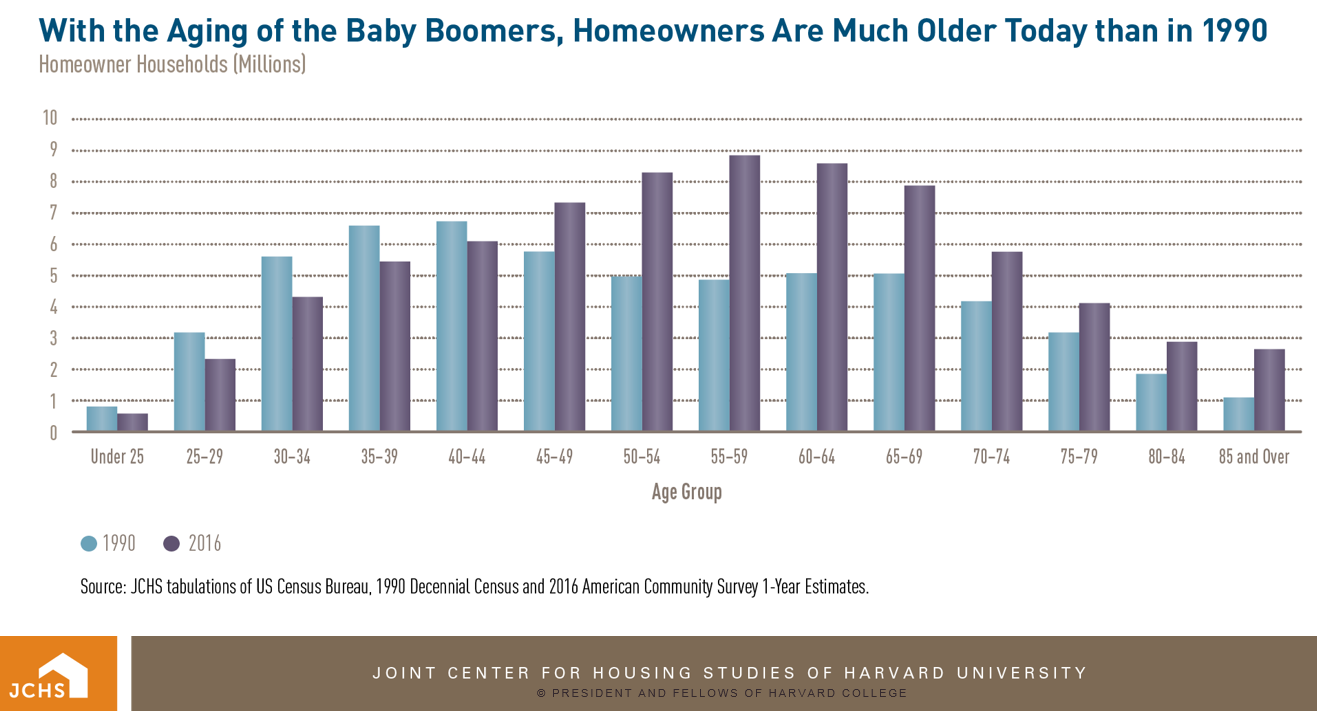
2. One in three homeowners is age 65 or over. In Joint Center household projections a few years ago, we anticipated that by 2035, one in three households would be age 65 or over. However, this year’s State of the Nation’s Housing report notes that in 2016 one in three homeowners already were 65 or over. This is a by-product of both the aging of the population (10,000 baby boomers turn 65 every day) and the sharp decline in homeownership rates among younger adults over the past two decades. The shift has had many implications. Given that older owners move less frequently, in many markets it has helped reduce the number of homes for sale. And where limited supplies have driven up home prices, those gains have created wealth for older owners and increased challenges for younger renters who want to become homeowners.
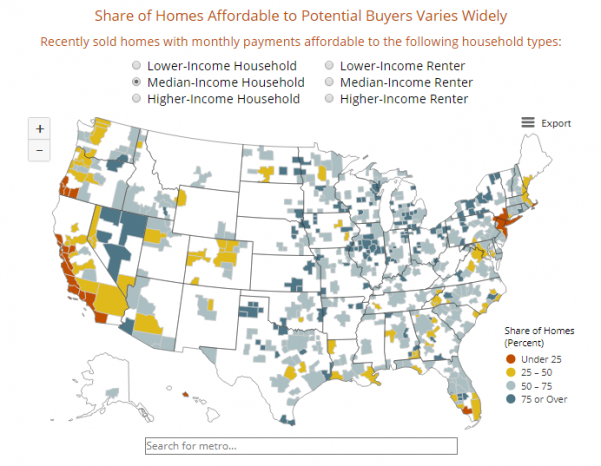
3. Only one in three renters has more than $10,000 in assets (INTERACTIVE). This is particularly notable because renters seeking to buy the median-priced home in the U.S. need about $14,000 to cover both a 3.5 percent down payment and to pay the estimated 2 percent in closing costs for that home. Even if they have the assets, many renters cannot afford the monthly mortgage payments needed to purchase recently-sold homes in many places, particularly large metros. At the extreme, only 11 percent of all renter and owner households in the Los Angeles metro (owners and renters) have incomes large enough that their monthly mortgage payment for the median-priced home sold in 2017 would not be more than 30 percent of their income. This means that 89 percent of that region’s households could not afford to buy the median priced home sold in the Los Angeles area in 2017.
4. Only 11 percent of the population moved in 2017. This is notable because it is the lowest mobility rate recorded since the government began tracking moves in the early 1960s. The decline in mobility is partially due to the overall aging of the population, but mostly due to sharp declines in mobility across age groups and particularly the young adults who, contrary to conventional wisdom, are the least mobile generation of young adults in recent history.

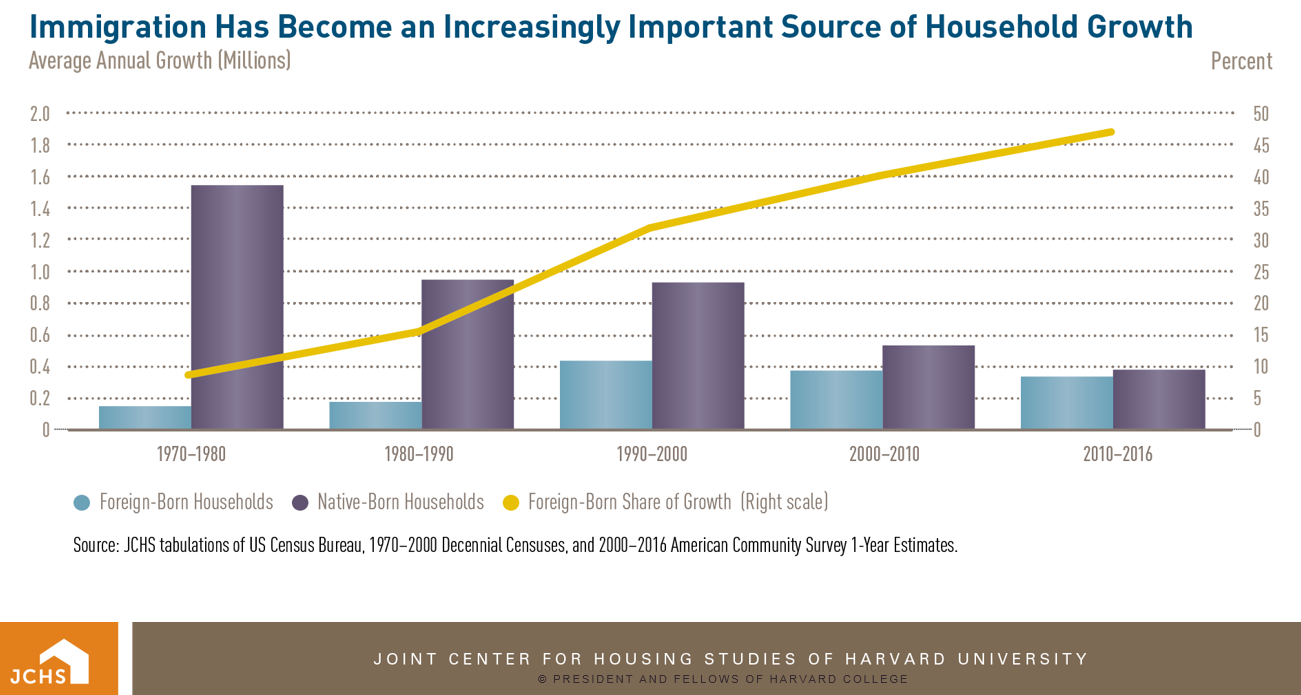
5. Households headed by immigrants accounted for 47 percent of household growth between 2010 and 2016. In contrast, immigrants accounted for 15 percent of household growth in the 1980s, 32 percent in the 1990s, and 41 percent in 2000s. Moreover, as the native-born population growth slows, immigration will be the primary driver of growth in total population and, in turn, growth in households. Assuming that the nation continues to add slightly more than one million net immigrants a year, as it has over the past four years, by 2040, immigration will account for two-thirds of total annual population growth in the U.S.
6. In 2017, the homeownership rate for 35-44 year olds was 8 percentage points below the 1988 rate. With 20 million households in this age group, the decline translates into 1.6 million fewer homeowner households than would have existed if the 2017 rate had equaled the 1988 rate. The rate for 25-34 year olds was 6 percentage points lower, equivalent to 1.1 million fewer homeowner households. The bottom line is that although the overall U.S. homeownership rate of 63.9 percent in 2017 was roughly equal with the 64.0 percent rate in 1988, rates among younger adults were much lower than they were while rates among those age 65 and over were higher.
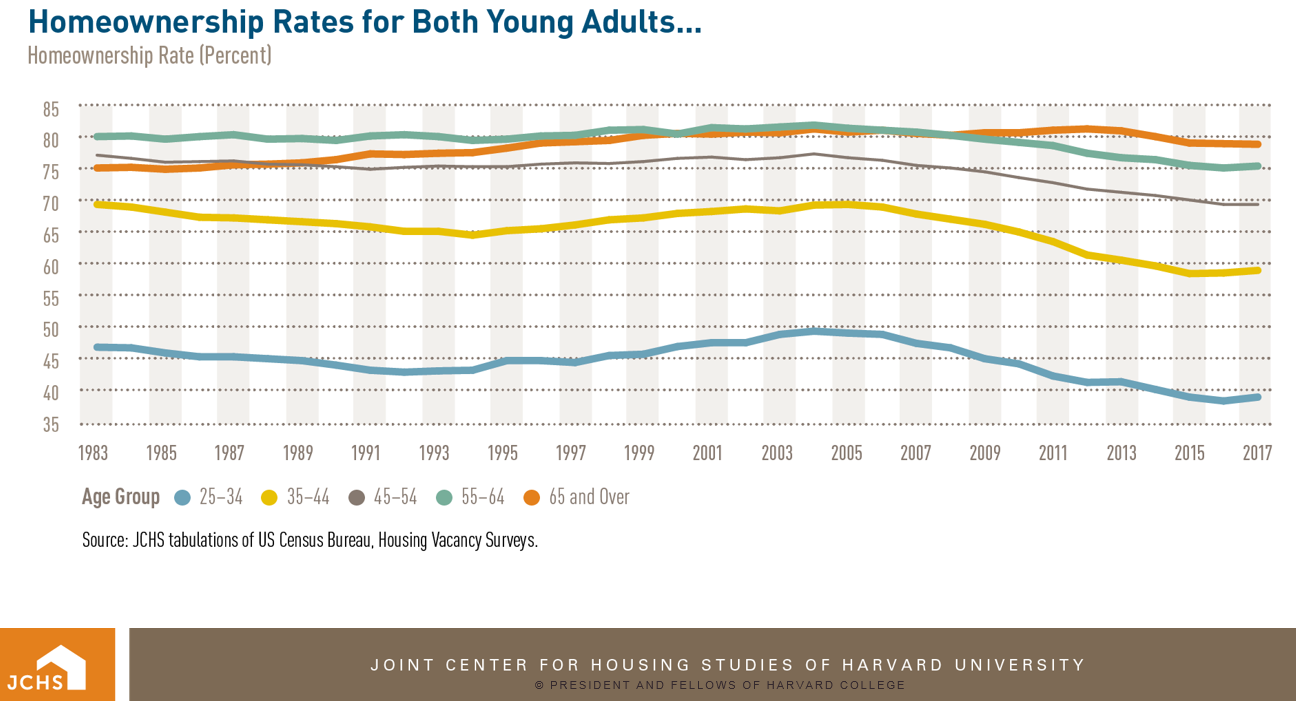
7. The black/white homeownership rate gap was 29.2 percentage points in 2017. Unlike other major race/ethnicity groups, black homeownership rates are actually 2.6 percentage points lower than in 1983 – the first year available from the Census Bureau’s dataset that tracks homeownership rates. At that time, the black homeownership rate was 23.5 percentage points lower than the white homeownership rate.

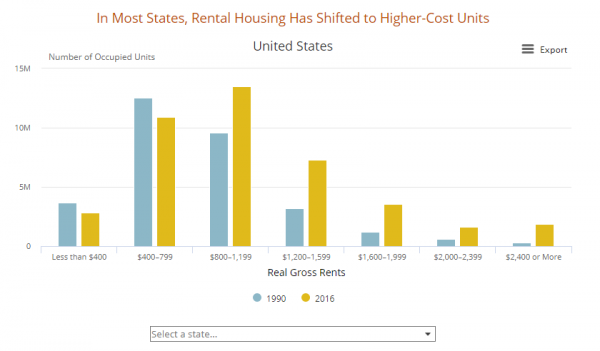
8. Between 1990 and 2016, the number of units renting for $800 (in real terms) declined by 2.5 million units (INTERACTIVE). In contrast, during that time, the number of renter households earning less than $32,000 per year (the income needed to afford a unit renting for $800) increased by 5 million. Although this occurred while 7 million new rental units were built, the median asking rent for units built in 2017 was $1,550 per month, which suggests that new construction is not addressing the shortfall of affordable units for low- and moderate-income renters.
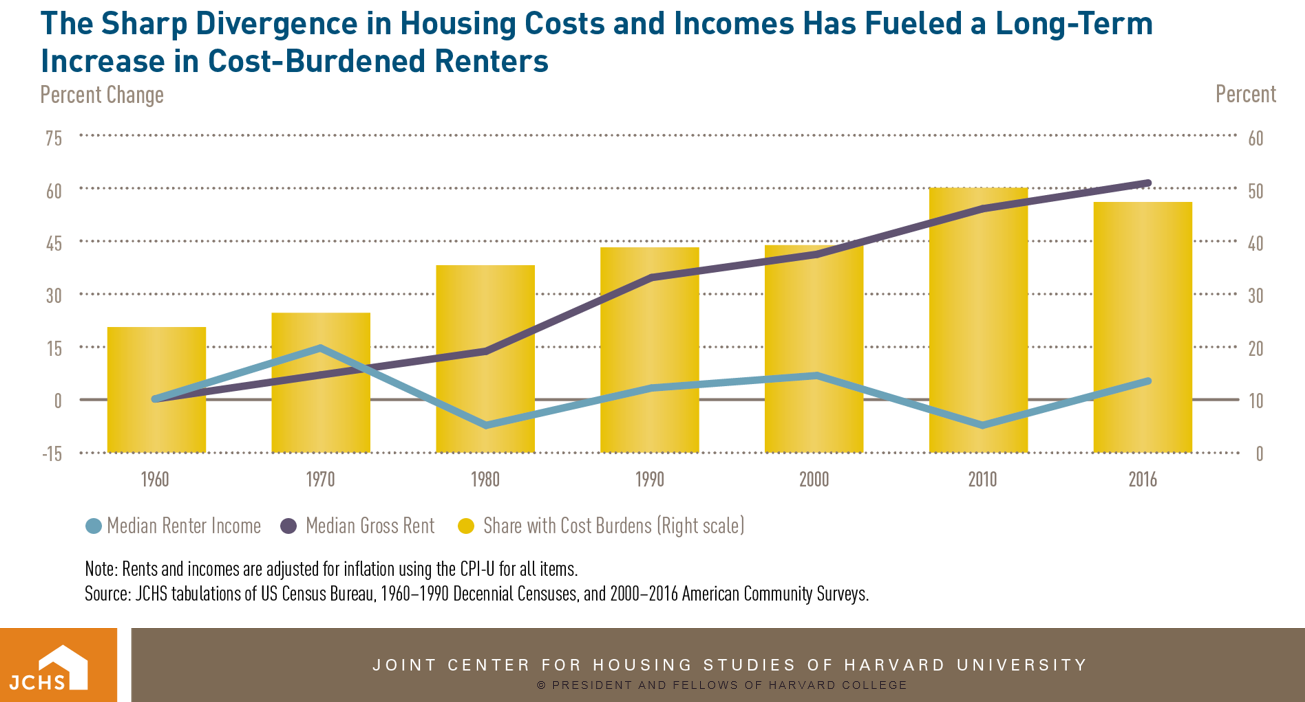
9. The real median income of renter households rose by less than one percent since 1990. In contrast, inflation-adjusted rents grew by 20 percent. As a result, the share of cost-burdened renters grew from just over a third of all renters in 1990 (39 percent) to nearly half (48 percent) in 2016.
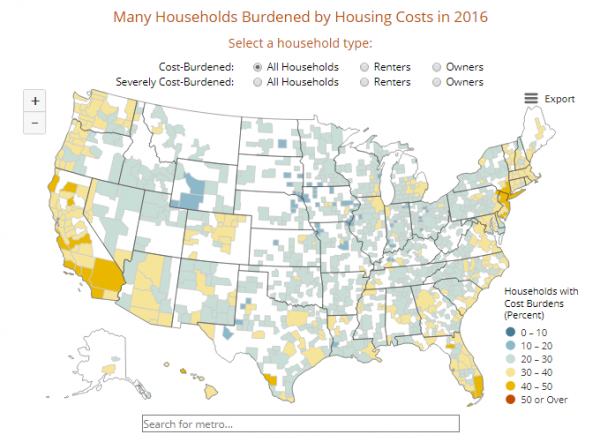
10. More than 38.1 million households – roughly one-third of all households – are cost-burdened (INTERACTIVE). We report this metric every year and every year the number is staggeringly high. Maintaining the appropriate context and a wide perspective of both the level and the trends of cost burden among households is important to recognize the dire condition of housing affordability in the U.S. For example, even though the cost burdens are down 2 percent over the past year, the number of cost-burdened households is still 20 percent higher than in 2001 (6.5 million households), and up by 14 million households since 1990. Moreover, the share of households that are cost-burdened has risen from 26.5 percent in 1990 to 32.0 percent at last measure in 2016.
These are ten facts that were particularly striking to me, but there are plenty of others. If you’d like to learn more, visit our State of the Nation’s Housing page where you’ll find the full report, a host of interactive maps and charts showing data from around the country, a fact sheet with more notable facts from this year’s report, and a 1988-2018 document showing how key housing metrics have changed over the last 30 years.


